Fig. 3
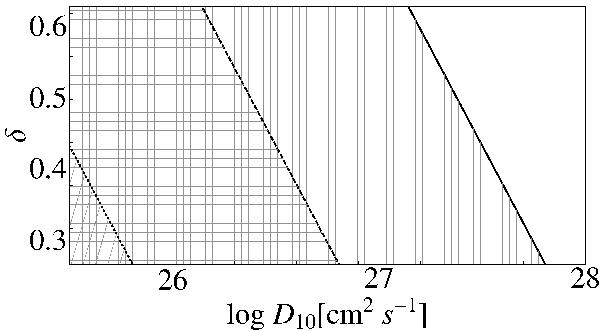
Boundaries for a break at energies higher than 70 GeV (in the emitted γ-ray spectrum) for different ages of the accelerator (103,4,5 years are represented by solid, dashed, dotted curves, respectively). The parameter space at the left of the boundaries results in a break in the spectrum within the energy domain of CTA.
Current usage metrics show cumulative count of Article Views (full-text article views including HTML views, PDF and ePub downloads, according to the available data) and Abstracts Views on Vision4Press platform.
Data correspond to usage on the plateform after 2015. The current usage metrics is available 48-96 hours after online publication and is updated daily on week days.
Initial download of the metrics may take a while.