Fig. 1
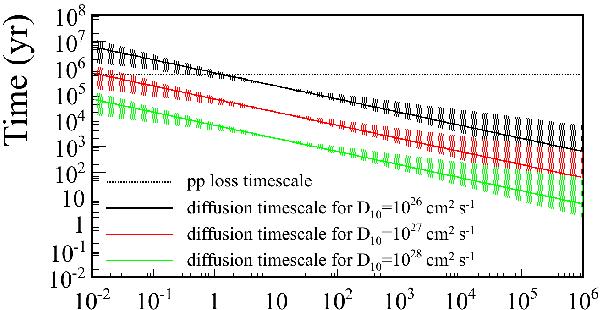
Comparison of relevant timescales calculated via Eqs. (3) and (4). The dashed line represents the loss timescale through pp channel. The shaded areas represent the diffusion timescale for the interval δ = [0.3...0.6] . The solid lines are for δ = 0.5. The crossing of the dashed and solid lines represent the minimal energy at which total cloud penetration is fulfilled for a diffusion coefficient of D10 = 1026 cm2 s-1 (black), D10 = 1027 cm2 s-1 (red), D10 = 1028 cm2 s-1 (green).
Current usage metrics show cumulative count of Article Views (full-text article views including HTML views, PDF and ePub downloads, according to the available data) and Abstracts Views on Vision4Press platform.
Data correspond to usage on the plateform after 2015. The current usage metrics is available 48-96 hours after online publication and is updated daily on week days.
Initial download of the metrics may take a while.