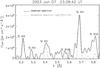
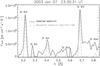
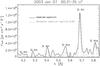
Fig. 1
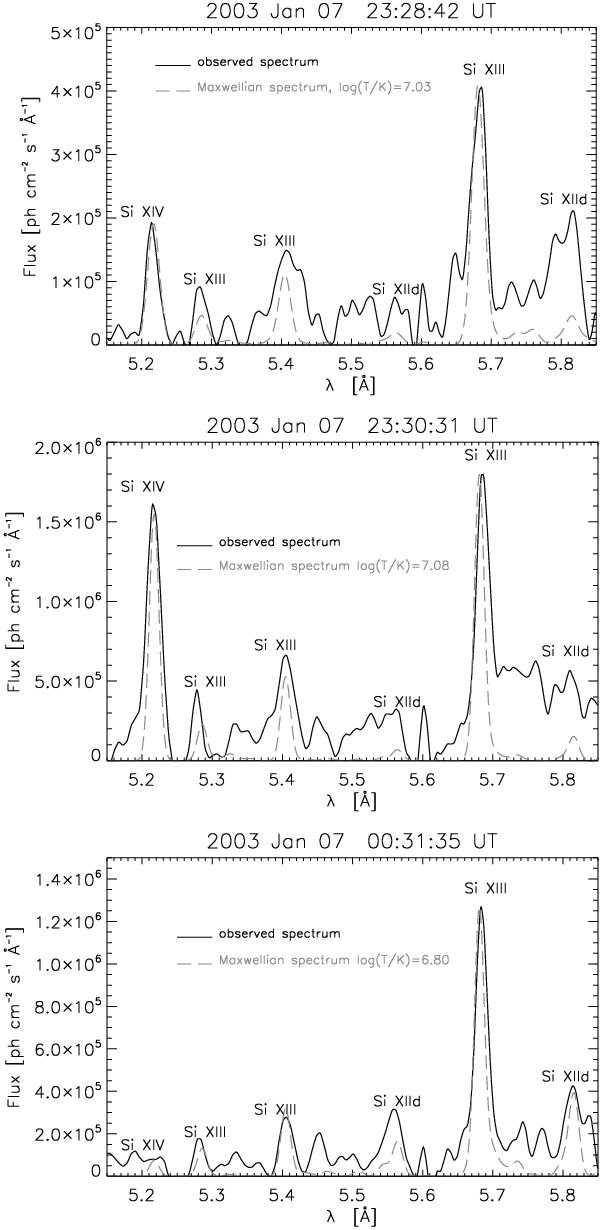
X-ray spectra observed by the RESIK instrument during impulsive (top and middle) and decay (bottom) phase of an M4.9 flare on January 07, 2003 (Dzifčáková et al. 2008). Synthetic Maxwellian isothermal Si spectra having the same Si xiv λ5.22/Si xiii λ5.68 ratio are indicated by the grey dashed lines. Note that the RESIK observations contain a number of unidentified lines.
Current usage metrics show cumulative count of Article Views (full-text article views including HTML views, PDF and ePub downloads, according to the available data) and Abstracts Views on Vision4Press platform.
Data correspond to usage on the plateform after 2015. The current usage metrics is available 48-96 hours after online publication and is updated daily on week days.
Initial download of the metrics may take a while.