Fig. 3
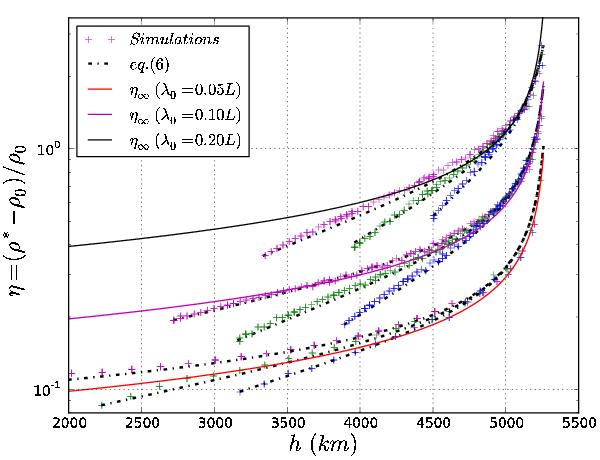
Profiles of shock strength. Dots represent the measurements from our numerical simulations: three different amplitudes (200, 100, 50 kms-1) in magenta, green and blue respectively for each wavelength families represented by their common asymptote Eq. (7) for the three wavelengths (λ0 = 0.05 L, 0.1 L, 0.2 L in solid lines in red, magenta and black respectively). Also plotted are the predictions from Eq. (6) in black dashed lines.
Current usage metrics show cumulative count of Article Views (full-text article views including HTML views, PDF and ePub downloads, according to the available data) and Abstracts Views on Vision4Press platform.
Data correspond to usage on the plateform after 2015. The current usage metrics is available 48-96 hours after online publication and is updated daily on week days.
Initial download of the metrics may take a while.