Fig. 1
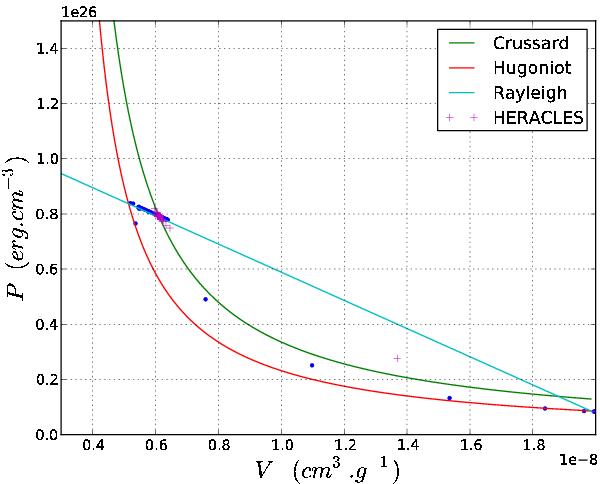
Pressure (P)-specific volume (V) diagram of a forced detonation in a plasma of density ρ0 = 5 × 10⁷ gcm-3. The Hugoniot curve represents the energy conservation through a shock, the Rayleigh line is the line of mass and momentum conservation and the Crussard curve corresponds to the energy conservation after the nuclear burning is complete. Each blue point is the (P,V) value of a simulation cell from the high resolution code, ASTROLABE. This simulation resolves the reaction zone following the leading shock, while the crosses representing the simulation cells of the code HERACLES, jump directly to the final state. This demonstrates that even without resolving the combustion zone, this code reproduces the correct energetics and dynamics.
Current usage metrics show cumulative count of Article Views (full-text article views including HTML views, PDF and ePub downloads, according to the available data) and Abstracts Views on Vision4Press platform.
Data correspond to usage on the plateform after 2015. The current usage metrics is available 48-96 hours after online publication and is updated daily on week days.
Initial download of the metrics may take a while.