| Issue |
A&A
Volume 550, February 2013
|
|
|---|---|---|
| Article Number | A72 | |
| Number of page(s) | 4 | |
| Section | Planets and planetary systems | |
| DOI | https://doi.org/10.1051/0004-6361/201220464 | |
| Published online | 29 January 2013 | |
Dust mantle of comet 9P/Tempel 1: dynamical constraints on physical properties
1 Department of Physics, Nagoya University, Nagoya, 464-8602 Aichi, Japan
e-mail: This email address is being protected from spambots. You need JavaScript enabled to view it.
2 Center for Planetary Science, c/o Integrated Research Center of Kobe University, Chuo-ku Minatojima Minamimachi 7-1-48, 650-0047 Kobe, Japan
3 Center for Environmental Measurement and Analysis, National Institute for Environmental Studies, 16-2 Onogawa, Tsukuba, 305-8506 Ibaraki, Japan
Received: 28 September 2012
Accepted: 3 December 2012
Abstract
The trajectories of dust particles ejected from a comet are affected by solar radiation pressure as a function of their ratios of radiation pressure cross section to mass. Therefore, a study of the orbital evolution of the particles caused by the radiation pressure reveals the physical properties of dust on the surface of the comet nucleus. In the course of NASA’s Deep Impact mission, the ejecta plume evolved under the influence of the radiation pressure. From the evolution and shape of the plume, we have succeeded in obtaining β ≈ 0.4, where β is the ratio of the radiation pressure to the solar gravity. Taking β ≈ 0.4 into account as well as the observational constraints of a high color temperature and a small silicate-feature strength, dust particles ejected from the surface of comet 9P/Tempel 1 are likely to be compact dust aggregates of sizes ≈ 20 μm (mass ~ 10-8 g). This is comparable to the major dust on the surface of comet 1P/Halley (~10 μm) inferred from in-situ measurements and theoretical considerations. Since such dust aggregates with β ≈ 0.4 must have survived jets due to ice sublimation on the surface, the temperature of ice in the nucleus must be kept below 145 K, which is much lower than the equilibrium temperature determined by solar irradiation and thermal emission. These facts indicate that 9P/Tempel 1 has a dust mantle composed of 20 μm-sized dust aggregates with low thermal conductivities ~1 erg cm-1 K-1 s-1.
Key words: comets: individual: 9P/Tempel 1 / dust, extinction / methods: data analysis / radiation mechanisms: general / comets: general / conduction
© ESO, 2013
1. Introduction
Short-period comets are very likely born in the outer solar system. They were originally composed of ice and dust particles. When the comets approach the sun, volatile components of their nuclei start to sublimate. A jet of volatile gases pushes out dust having a high surface-to-volume ratio and selectively leaves the heavy dust of a low surface-to-volume ratio (Prialnik et al. 2004, for a review). Therefore, relatively compact particles form the so-called dust mantle of comets.
Dust particles emitted from comets give us important information on the surfaces of the comets related to their histories. Such a dust particle feels solar radiation pressure, and then its orbit is determined by the ratio β of the radiation pressure to solar gravity, which depends on the morphology, size, and composition of the particle. The β values of particles are derived from the shapes of comet tails and trails (Finson & Probstein 1968; Fulle 1989; Ishiguro et al. 2007; Ishiguro 2008). Tail and trail particles of masses 10-5–10-3 g occupy higher end of the distribution in cometary comae, since smaller particles are blown away by the radiation pressure after leaving the comet nuclei. In-situ measurements of dust in the coma of comet 1P/Halley have shown that a typical coma dust particle has a mass of 10-10–10-9 g (Kolokolova et al. 2007). Because large dust particles in tails and trails are most likely a minor component on the cometary surface, we cannot derive the β values of typical dust particles on surfaces of comets from tail and trail observations. Therefore, determining the β value from observations of comet comae is preferable. Hayward et al. (2000) attempted to derive the β value from barred structures formed in a coma of comet Hale-Bopp (C/1995 O1) and found β < 1. Because a continuous anisotropic ejection of dust particles in a coma blurs the trajectory of the particles, it is difficult to tightly constrain the β value.
The advent of a promising occasion for a tight constraint on the β value was the Deep Impact (DI) mission, which successfully collided a 366 kg impactor with comet 9P/Tempel 1 (A’Hearn 2007). The resulting ejecta plume was observed by space telescopes and by telescopes on Earth, which emerged after the DI collision, expanded in about a day, and then vanished in several days. The plume produced by such a single collision contained typical dust on the cometary surface, and the dissipation of the plume reflected the blow-away of the dust due to the radiation pressure. The β ratio is estimated to be 0.08–1.9 based on data analyses of a temporal evolution on the brightness peak position and the shape of the plume at a given time (Meech et al. 2005; Milani et al. 2007; Walker et al. 2007; Boehnhardt et al. 2007). These estimates of β unfortunately include large uncertainties, because the analyses were based on limited observational data.
In this paper, we succeed for the first time in obtaining a tight constraint on the β value of typical dust particles on the surface of the comet, by considering both the temporal evolution in the distance to the plume’s leading edge at the solar direction and the plume shape at the time when the shape is significantly modified by the radiation pressure. We then use the obtained β values to discuss the physical properties of dust particles, which were originally on the surface of the nucleus and produced by the DI impact. Successful determination of the β ratio enables us to estimate the mass and size of the dust particles based on the observational and theoretical considerations and the temperature of cometary ice, which has been kept low due to the existence of a dust mantle on the nucleus. We show that the thermal conductivity and porosity of the dust mantle could also be deduced from our estimate of the β value.
2. Model
Dust particles were ejected from the nucleus of comet Tempel 1 by the DI event. These ejecta made an ejecta plume. According to an impact-cratering theory, higher velocity ejacta come from a shallower layer of the target surface, and ejecta from the deeper region have lower velocities (e.g., Croft 1980). The ejecta in the leading edge of the plume are thus composed of dust particles on the surface of the comet nucleus, while the ejecta from the deeper region are mainly in the inner plume. Therefore, we could obtain the information for dust particles on the surface of cometary nucleus from the leading edge of the plume.
The motion of the ejecta is mainly governed by radiation pressure from the sun. The observation from Earth showed that the ejecta plume expanded isotropically around the impact direction within several hours from the DI event (Feldman et al. 2007). We assume that particles ejected from the surface just after the DI collision have a velocity projected to the plane perpendicular to the line of sight, v0. It should be noted that v0 is lower than the real ejecta velocity by a factor 1.5–2 (Ipatov & A’Hearn 2011). We treat their orbits on the plane. We set the x-axis in the direction to the sun on the plane and the y-axis perpendicular to the x-axis. The position (x,y) of an ejecta at time t after the collision of DI impactor is given by 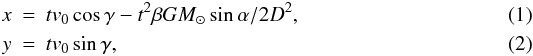 where D ≈ 1.5 AU is the distance of comet 9P/Tempel 1 from the sun at the DI event, α ≈ 48° is the angle between the line of sight and the incident radiation from the sun, G the gravitational constant, and γ the angle between the direction of the projected velocity and the x axis. The β ratio is given by (e.g., Burns et al. 1979)
 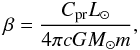 (3)where Cpr is the radiation pressure cross section of the ejecta, m its mass, L⊙ the solar luminosity, M⊙ the solar mass, and c the speed of light.
Although the ejecta caused by the DI have various values of β and v0, not all of them are observable. Jorda et al. (2007) have investigated the ejecta plume profile by adopting distributions of β and v0 and find that the total cross section of dust particles was almost determined by single values for v0 and β. We therefore assume dust particles have a single value of β and eject with a velocity v0. In Fig. 1, the dashed line given by Eqs. (1) and (2) with certain β and v0 is hereafter called the leading edge of the plume at a certain time after the DI collision, where we assume the ejection is isotropic. The plume profile is determined by the β and v0 values. Since the radiation pressure modifies the plume shape, the distance of the plume leading edge from Tempel 1 depends on the angle θ = arctan(y/x); the distance at around θ ≈ 0 is shorter than that at a large | θ | . The spatial distribution thus allows us to constrain β and v0. Nevertheless, since the observed plume shape includes errors, β and v0 could not be determined solely from the profile at a certain time. The time evolution of the leading distance at θ = 0° could give a further constraint to fix these values.
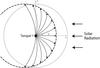 |
Fig. 1 Schematic for the ejecta plume leading edge profile. The profile is modified by solar radiation (dashed lines). For reference, the profile without the radiation is represented by the circle with dotted lines. |
3. Results
At first, we focus on the spatial distribution of ejecta plume. Hubble Space Telescope observations within several hours after the DI collision show that the plume of ejecta are almost isotropic for the front side of the impact within θ = −145°−35° (Feldman et al. 2007). We therefore assumed an isotropic distribution of γ. The shape of the plume was then significantly modified after t ≈ 1 day (e.g., Tozzi et al. 2007; Walker et al. 2007). Walker et al. (2007) present the distance of the plume front from the nucleus at t = 25 h after the impact. In Fig. 2, we compare the model calculations given by Eqs. (1) and (2) with the observational data by Walker et al. (2007). Large β leads to the substantial variation in the distance at the solar direction, while the variation in v0 produces the difference of the distance independent of θ. We have found several possible combinations of β and v0 to explain the data: e.g., v0 = 210 m s-1 and β = 0.4 or β = 0.65 and v0 = 215 m s-1 as shown in Fig. 2. However, there are still uncertainties in those values of v0 and β determined only from the spatial distribution. Therefore, we try to give a further constraint on β and v0, by taking the time variation of the plume into account.
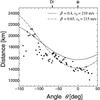 |
Fig. 2 Distance of the ejecta plume leading edge from Tempel 1 as a function of angle to solar direction on the view plane, θ = arctan(y/x). Dots represent observational data at 25 h after the Deep Impact collision by Walker et al. (2007) (the brightness contour with 2 ADU). Equations (1) and (2) gives the ejecta plume front taking β = 0.4 and v0 = 210 m s-1 (solid curve) and β = 0.6 and v0 = 215 m s-1 (dashed curve). The direction of initial plume emergence is indicated by DI and that of the sun is by ⊙ . |
Figure 3 shows the temporal evolution of the distance to the leading edge to the observed ejecta plume at θ = 0° in comparison with the model. The relation between the distance and time is linear due to a constant velocity until about one day, but the ejecta were then significantly decelerated by the radiation pressure. The evolution predicted by Eq. (1) with β = 0.4 and v0 = 210 m s-1 is in good agreement with the distance evolution obtained from the observations. The time at the peak distance, tpeak, is determined by dx/dt = 0, given by 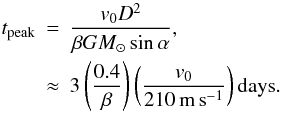 (4)The distance decreases by the radiation pressure at t > tpeak and the ejecta plume is blown away completely at t ≳ 2tpeak. If we choose β = 0.65 and v0 = 215 m s-1, tpeak ≈ 2 days; the leading distances after two days are inconsistent with the observational data. In addition, the maximum projected distance in the sunward direction obtained from six days of observations by Meech et al. (2005) was 3 × 10⁴ km, which is explained by ejecta with β ≈ 0.4 because the peak distance is given by v0tpeak/2 ≈ 2.8 × 10⁴(β/0.4)-1(v0/210 m s-1)2 km. Therefore, taking the time variation and the spatial distribution into account, β ≈ 0.4 and v0 ≈ 210 m s-1 are the likely solutions.
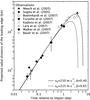 |
Fig. 3 Time evolution of the leading edge distance from observations (Meech et al. 2005; Sugita et al. 2005; Boehnhardt et al. 2007; Furusho et al. 2007; Kadono et al. 2007; Lara et al. 2007; Walker et al. 2007; Bauer et al. 2007). The solid curve is given by Eq. (1) with β = 0.4 and v0 = 210 m s-1. The dashed curve is with β = 0.65 and v0 = 215 m s-1. |
4. Discussion
Several authors have derived the β values within 0.08–1.9 from the shape of the ejecta plume at a given time or the temporal evolution of brightness peak position (Meech et al. 2005; Milani et al. 2007; Walker et al. 2007; Boehnhardt et al. 2007; Richardson et al. 2007; Kelley et al. 2009). Schleicher et al. (2006) have estimated the lower limit of β as about 0.24 through a sophisticated simulation using a Monte Carlo jet model. On the other hand, we applied a simple model described by Eqs. (1) and (2), whose transparent dependences of β and v0 easily give a constraint on them, and have analyzed both the leading distance evolution of the plume at the direction to the sun and the shape of the plume at 25 h after the DI event.
We have found that dust mainly determining the shape of the ejecta plume has β ≈ 0.4. Equation (3) gives Cpr/m ≈ 5200 cm2 g-1 for β = 0.4. This value corresponds to in radius for spherical particles having internal density 2.5 g cm-3 with Cpr given by geometrical cross section (Burns et al. 1979). However, dust particles mainly composing the ejecta plume are very likely compact dust aggregates, which account for the observational data of a silicate-feature strength and a color temperature (Yamamoto et al. 2008). According to Yamamoto et al. (2008), compact aggregates are assumed to have a fractal dimension of D = 2.5. We apply the description of fractal aggregates given in Mukai et al. (1992), using monomers of an aggregate with radius and interior density 2.5 g cm-3. We approximate  , where A is the projected area of an aggregate and
  with rg being the gyration radius of an aggregate. Dust aggregates with β = 0.4 approximately have (m ~ 10-8 g ). On the other hand, based on in-situ measurements of 1P/Halley, compact dust aggregates with (m ~ 10-10–10-9 g) contribute most to the cross-section area on the surface of comet Halley (McDonnell et al. 1987; Kolokolova et al. 2007). Both DI ejecta from the surface of Tempel 1, and typical dust aggregates of comet Halley have sizes on the order of , which may be determined by the temperature history of the icy core of the nuclei. Therefore, we conclude that the surface layers of short-period comets are mainly composed of such large aggregates.
A dust particle with the projected area A and mass m on the comet nucleus with mass M and radius R is blown away due to volatile sublimation if APv ≲ GMm/R2, where Pv is the vapor pressure (Prialnik et al. 2004). Since A/m ≈ 4πcGM⊙β/L⊙ from Eq. (3) with Cpr ≈ A, the condition for blowing out particles with β is rewritten as Pv ≳ ML⊙/4πcR2M⊙β. Since water ice is the main volatile material, Pv is determined by water ice sublimation. As shown above, particles ejected by the DI event mainly have β ≈ 0.4, which survive the ice sublimation on the nucleus surface. From this fact, we can estimate an upper limit on the value of vapor pressure, which indicates that the temperature of ice in the comet nucleus should have been kept lower than about 145 K. The ice temperature estimated above is lower than that on the nucleus surface, which is calculated from the equilibrium between solar irradiation and its thermal emission. Such a low ice temperature therefore implies that the nucleus is covered with a dust layer that has a low thermal conductivity.
Finally, we derive the thermal conductivity of the dust mantle here. The thickness of the dust mantle, Ld, is much less than the radius of the nucleus. The heat flux in the dust mantle is given by kd(Ts − Ti)/Ld, where kd is the thermal conductivity of the dust mantle, Ts the temperature at the nucleus surface, and Ti the temperature at the boundary between the dust mantle and the ice core. The surface temperature obtained from the fitting of a nucleus spectrum varies from 272 ± 7 K to 336 ± 7 K (Groussin et al. 2007). The excavation depth due to the DI impact indicates Ld ~ 100–200 cm (Yamamoto et al. 2008). The conductive flux received on the surface of the ice core should equal the ice sublimation energy on the ice core surface, and the equilibrium with Ti = 145 K results in kd ≈ 1.1((Ts − Ti)/190 K)-1(Ld/200 cm) erg cm-1 K-1 s-1. Dust particles in the dust mantle of Temple 1 that we have obtained from β have a porosity of 0.99 (or a filling factor φ of 0.01). The mean free path of photons in an aggregate is small enough that the radiative conductivity is negligible in the temperature range of interest. From laboratory experiments, the thermal conductivity was derived to be 102–103 erg cm-1 K-1 s-1 for dust layers with φ = 0.1 − 0.6 (Krause et al. 2011; Gundlach & Blum 2012). The relation kd ∝ φp derived from theoretical analysis can explain experiments for aerogels using power-law index p ≈ 1.5 (Fricke et al. 1992; Hrubesh & Pekala 1994; Lu et al. 1995). The thermal conduction for dust layers measured by Krause et al. (2011) is also described well by a power-law formula with p = 1.5 (although p ≈ 1.8 is better). From the fitting formula, we estimate the thermal conductivity to be 1–10 erg cm-1 K-1 s-1 for dust aggregates with φ = 0.01. Dust aggregates forming the dust mantle, which can explain several facts obtained from the DI event, have a high porosity and produce this low thermal conductivity of the dust mantle.
Acknowledgments
We acknowledge an anonymous reviewer who provided helpful comments for revising the original manuscript. We thank Kazunari Iwasaki, Satoshi Okuzumi, and Jürgen Blum for valuable discussions. This research is supported by the grants from CPS, JSPS (21340040), and MEXT (23103005).
References
- A’Hearn, M. F. 2007, Icarus, 187, 1 [NASA ADS] [CrossRef] [Google Scholar]
- Burns, J. A., Lamy, P. L., & Soter, S. 1979, Icarus, 40, 1 [NASA ADS] [CrossRef] [Google Scholar]
- Bauer, J. M., Weissman, P. R., Choi, Y.-J., et al. 2007, Icarus, 187, 296 [NASA ADS] [CrossRef] [Google Scholar]
- Boehnhardt, H., Pompei, E., Tozzi, G. P., et al. 2007, A&A, 470, 1175 [NASA ADS] [CrossRef] [EDP Sciences] [Google Scholar]
- Croft, S. K. 1980, Lunar Plan. Sci. Conf. Proc., 11, 2347 [NASA ADS] [Google Scholar]
- Feldman, P. D., McCandliss, S. R., Route, M., et al. 2007, Icarus, 187, 113 [NASA ADS] [CrossRef] [Google Scholar]
- Finson, M. L., & Probstein, R. F. 1968, ApJ, 154, 327 [NASA ADS] [CrossRef] [Google Scholar]
- Fricke, J., Lu, X., Wang, P., Büttner, D., & Heinemann, U. 1992, Int. J. Hear Mass Trans., 35, 2305. [CrossRef] [Google Scholar]
- Fulle, M. 1989, A&A, 217, 283 [NASA ADS] [Google Scholar]
- Furusho, R., Ikeda, Y., Kinoshita, D., et al. 2007, Icarus, 190, 454 [NASA ADS] [CrossRef] [Google Scholar]
- Gundlach, B., & Blum, J. 2012, Icarus, 219, 618 [NASA ADS] [CrossRef] [EDP Sciences] [Google Scholar]
- Groussin, O., A’Hearn, M. F., Li, J.-Y., et al. 2007, Icarus, 187, 16 [NASA ADS] [CrossRef] [Google Scholar]
- Hayward, T. L., Hanner, M. S., & Sekanina, Z. 2000, ApJ, 538, 428 [NASA ADS] [CrossRef] [Google Scholar]
- Hrubesh, L. W., & Pekala, R. W. 1994, J. Mater. Res., 9, 731 [NASA ADS] [CrossRef] [Google Scholar]
- Ipatov, S. I., & A’Hearn, M. F. 2011, MNRAS, 414, 76 [NASA ADS] [CrossRef] [Google Scholar]
- Ishiguro, M. 2008, Icarus, 193, 96 [NASA ADS] [CrossRef] [Google Scholar]
- Ishiguro, M., Sarugaku, Y., Ueno, M., et al. 2007, Icarus, 189, 169 [NASA ADS] [CrossRef] [Google Scholar]
- Jorda, L., Lamy, P., Faury, G., et al. 2007, Icarus, 187, 208 [NASA ADS] [CrossRef] [Google Scholar]
- Kadono, T., Sugita, S., Sako, S., et al. 2007, ApJ, 661, L89 [NASA ADS] [CrossRef] [Google Scholar]
- Kelley, M. S., Reach, W. T., & Woodward, C. E. 2009, Deep Impact as a World Observatory Event: Synergies in Space, Time, and Wavelength, 125 [Google Scholar]
- Kimura, H., Okamoto, H., & Mukai, T. 2002, Icarus, 157, 349 [NASA ADS] [CrossRef] [Google Scholar]
- Kolokolova, L., Kimura, H., Kiselev, N., & Rosenbush, V. 2007, A&A, 463, 1189 [NASA ADS] [CrossRef] [EDP Sciences] [Google Scholar]
- Krause, M., Blum, J., Skorov, Y. V., & Trieloff, M. 2011, Icarus, 214, 286 [NASA ADS] [CrossRef] [Google Scholar]
- Lara, L. M., Boehnhardt, H., Gredel, R., et al. 2007, A&A, 465, 1061 [NASA ADS] [CrossRef] [EDP Sciences] [Google Scholar]
- Lu, X., Caps, R., Fricke, J., Atlviso, C. T., & Pekala, R. W. 1995, J. Non-Cryst. Solids, 188, 226 [Google Scholar]
- McDonnell, J. A. M., Evans, G. C., Evans, S. T., et al. 1987, A&A, 187, 719 [NASA ADS] [Google Scholar]
- Meech, K. J., Ageorges, N., A’Hearn, M. F., et al. 2005, Science, 310, 265 [NASA ADS] [CrossRef] [Google Scholar]
- Milani, G. A., Szabó, G. M., Sostero, G., et al. 2007, Icarus, 187, 276 [Google Scholar]
- Mukai, T., Ishimoto, H., Kozasa, T., Blum, J., & Greenberg, J. M. 1992, A&A, 262, 315 [NASA ADS] [Google Scholar]
- Prialnik, D., Benkhoff, J., & Podolak, M. 2004, Comets II, 359 [Google Scholar]
- Richardson, J. E., Melosh, H. J., Lisse, C. M., & Carcich, B. 2007, Icarus, 190, 357 [NASA ADS] [CrossRef] [Google Scholar]
- Schleicher, D. G., Barnes, K. L., & Baugh, N. F. 2006, AJ, 131, 1130 [NASA ADS] [CrossRef] [Google Scholar]
- Sugita, S., Ootsubo, T., Kadono, T., et al. 2005, Science, 310, 274 [NASA ADS] [CrossRef] [Google Scholar]
- Tozzi, G. P., Boehnhardt, H., Kolokolova, L., et al. 2007, A&A, 476, 979 [NASA ADS] [CrossRef] [EDP Sciences] [Google Scholar]
- Walker, R. G., Weaver, W. B., Shane, W. W., & Babcock, A. 2007, Icarus, 187, 285 [NASA ADS] [CrossRef] [Google Scholar]
- Yamamoto, S., Kimura, H., Zubko, E., et al. 2008, ApJ, 673, L199 [NASA ADS] [CrossRef] [Google Scholar]
All Figures
|
Fig. 1 Schematic for the ejecta plume leading edge profile. The profile is modified by solar radiation (dashed lines). For reference, the profile without the radiation is represented by the circle with dotted lines. |
| In the text | |
|
Fig. 2 Distance of the ejecta plume leading edge from Tempel 1 as a function of angle to solar direction on the view plane, θ = arctan(y/x). Dots represent observational data at 25 h after the Deep Impact collision by Walker et al. (2007) (the brightness contour with 2 ADU). Equations (1) and (2) gives the ejecta plume front taking β = 0.4 and v0 = 210 m s-1 (solid curve) and β = 0.6 and v0 = 215 m s-1 (dashed curve). The direction of initial plume emergence is indicated by DI and that of the sun is by ⊙ . |
| In the text | |
|
Fig. 3 Time evolution of the leading edge distance from observations (Meech et al. 2005; Sugita et al. 2005; Boehnhardt et al. 2007; Furusho et al. 2007; Kadono et al. 2007; Lara et al. 2007; Walker et al. 2007; Bauer et al. 2007). The solid curve is given by Eq. (1) with β = 0.4 and v0 = 210 m s-1. The dashed curve is with β = 0.65 and v0 = 215 m s-1. |
| In the text | |
Current usage metrics show cumulative count of Article Views (full-text article views including HTML views, PDF and ePub downloads, according to the available data) and Abstracts Views on Vision4Press platform.
Data correspond to usage on the plateform after 2015. The current usage metrics is available 48-96 hours after online publication and is updated daily on week days.
Initial download of the metrics may take a while.