Fig. 8
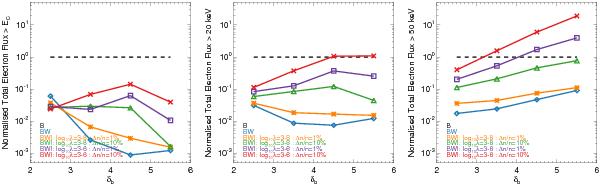
Total number of electrons above EC, 20 keV and 50 keV (left to right) as a function of the power-law index of the initial electron distribution δb, obtained from the fitting of f_thick2.pro to the simulated footpoint X-ray spectra. The differently coloured lines indicate the different simulation setups used. The number of electrons are normalised by those from the fit to the beam-only (B, black line) X-ray spectrum.
Current usage metrics show cumulative count of Article Views (full-text article views including HTML views, PDF and ePub downloads, according to the available data) and Abstracts Views on Vision4Press platform.
Data correspond to usage on the plateform after 2015. The current usage metrics is available 48-96 hours after online publication and is updated daily on week days.
Initial download of the metrics may take a while.