Fig. 2
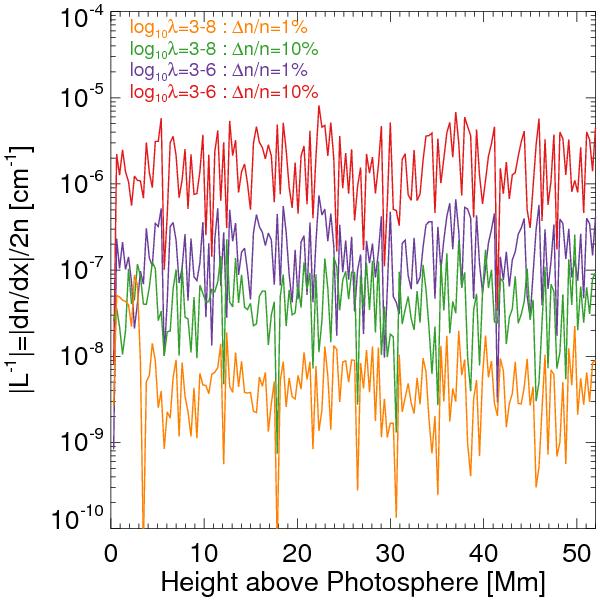
Magnitude of the characteristic scale of the plasma inhomogeneity L-1 as a function of height above the photosphere. It is shown for two different wavelength ranges, 103 ≤ λi ≤ 106 cm and 103 ≤ λi ≤ 108 cm, using amplitudes of 1% and 10%.
Current usage metrics show cumulative count of Article Views (full-text article views including HTML views, PDF and ePub downloads, according to the available data) and Abstracts Views on Vision4Press platform.
Data correspond to usage on the plateform after 2015. The current usage metrics is available 48-96 hours after online publication and is updated daily on week days.
Initial download of the metrics may take a while.