Free Access
Fig. 1
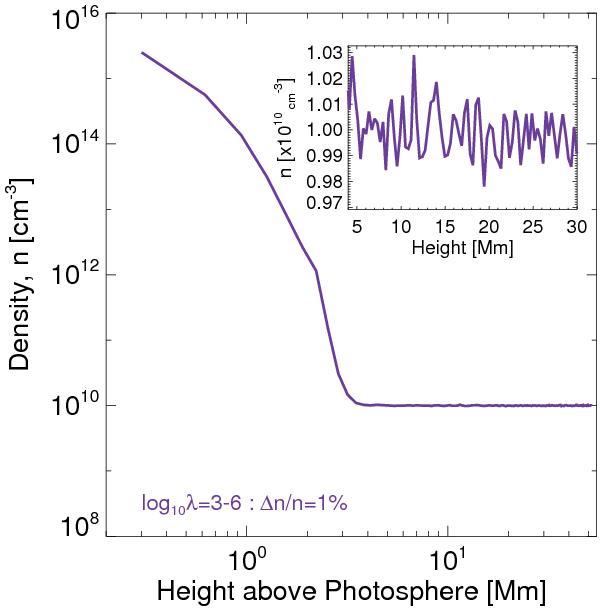
Background plasma density profile n. The inset view is of a zoomed portion of the density profile, showing that the density fluctuations (1000 of them with wavelengths between 103 ≤ λi ≤ 106 cm and amplitude of 1%) have been added to the background profile.
Current usage metrics show cumulative count of Article Views (full-text article views including HTML views, PDF and ePub downloads, according to the available data) and Abstracts Views on Vision4Press platform.
Data correspond to usage on the plateform after 2015. The current usage metrics is available 48-96 hours after online publication and is updated daily on week days.
Initial download of the metrics may take a while.