Fig. 9
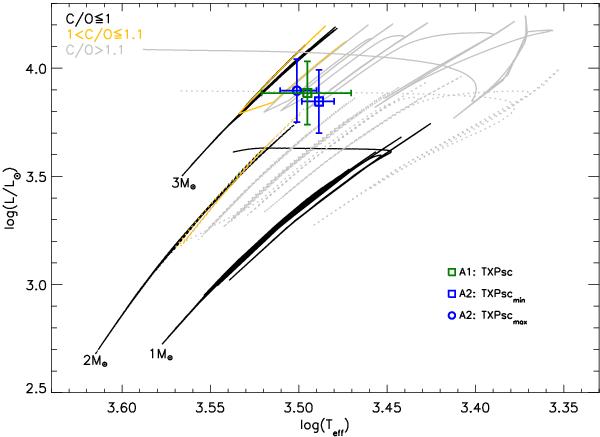
Zoom into the AGB region of the H-R diagram. Lines denote solar metallicity evolutionary tracks (Marigo et al., in prep.) and numbers indicate the mass on the early-AGB. Yellow/grey lines mark the region of carbon-rich AGB stars with C/O > 1.0. Black lines mark the region of oxygen-rich AGB stars (C/O ≤ 1). For better visibility, the track of the 2 M⊙ model is plotted with a dotted line. Different coloured symbols refer to the luminosity and effective temperature determined in this work (for the two different approaches A1 and A2 at visual minimum/maximum).
Current usage metrics show cumulative count of Article Views (full-text article views including HTML views, PDF and ePub downloads, according to the available data) and Abstracts Views on Vision4Press platform.
Data correspond to usage on the plateform after 2015. The current usage metrics is available 48-96 hours after online publication and is updated daily on week days.
Initial download of the metrics may take a while.