Free Access
Fig. 5
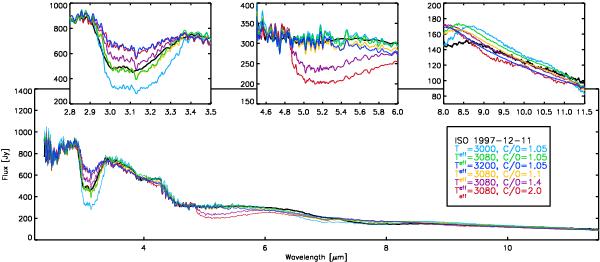
ISO/SWS spectrum of TX Psc at visual minimum from 11 Dec. 1997 (black line) plotted with hydrostatic models (coloured lines) of different temperatures and C/O ratios. The best-fitting model is plotted in green. Model spectra are normalized to the flux of the corresponding ISO spectrum at 2.9 μm.
Current usage metrics show cumulative count of Article Views (full-text article views including HTML views, PDF and ePub downloads, according to the available data) and Abstracts Views on Vision4Press platform.
Data correspond to usage on the plateform after 2015. The current usage metrics is available 48-96 hours after online publication and is updated daily on week days.
Initial download of the metrics may take a while.