Fig. 3
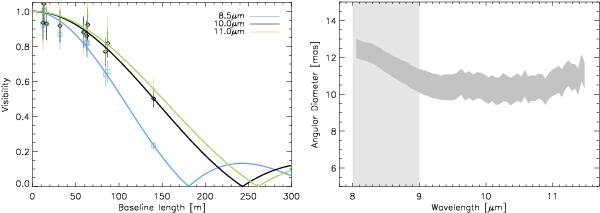
Left: calibrated visibilities (symbols) versus baseline length for three different wavelengths. The lines represent the best-fitting UD-model at the given wavelength. Right: spectrally dispersed angular diameter plus errors from the best-fitting UD-model (dark grey shaded area). The light grey shaded area marks the region that is omitted for the mean diameter estimation.
Current usage metrics show cumulative count of Article Views (full-text article views including HTML views, PDF and ePub downloads, according to the available data) and Abstracts Views on Vision4Press platform.
Data correspond to usage on the plateform after 2015. The current usage metrics is available 48-96 hours after online publication and is updated daily on week days.
Initial download of the metrics may take a while.