Fig. 9
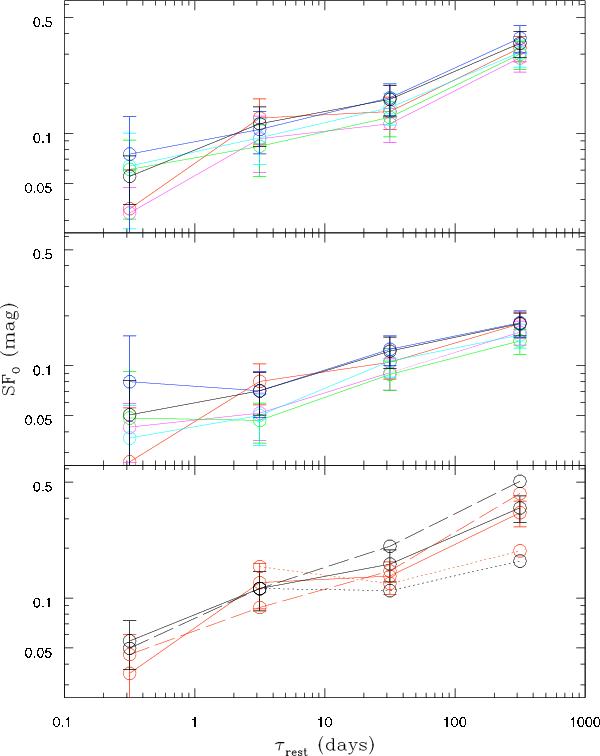
UV/optical structure function. Upper panel: whole sample B, UVOT filters UVW2 (black), UVM2 (blue), UVW1 (cyan), U (green), B (magenta), V (red). Middle panel: subsample with LUV ≥ 1029 erg s-1 Hz-1, same colour-code. Lower panel: NLS1 (dotted lines), BLS1 (dashed lines), whole sample B (continuous lines). Only the UVW2 filter (black) and the V filter (red) are shown.
Current usage metrics show cumulative count of Article Views (full-text article views including HTML views, PDF and ePub downloads, according to the available data) and Abstracts Views on Vision4Press platform.
Data correspond to usage on the plateform after 2015. The current usage metrics is available 48-96 hours after online publication and is updated daily on week days.
Initial download of the metrics may take a while.