Free Access
Fig. 7
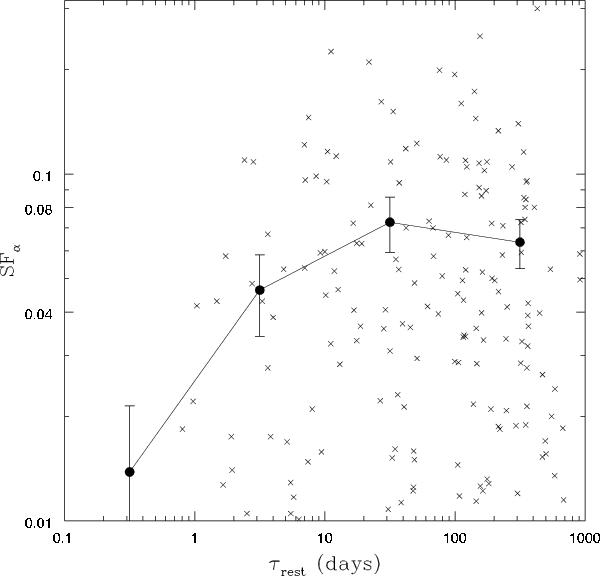
Structure function of αox(t) vs. the rest-frame time lag for sample B. The crosses represent the variations of individual sources for any pair of epochs. The filled circles connected by continuous lines represent the binned ensemble structure function.
Current usage metrics show cumulative count of Article Views (full-text article views including HTML views, PDF and ePub downloads, according to the available data) and Abstracts Views on Vision4Press platform.
Data correspond to usage on the plateform after 2015. The current usage metrics is available 48-96 hours after online publication and is updated daily on week days.
Initial download of the metrics may take a while.