Fig. 6
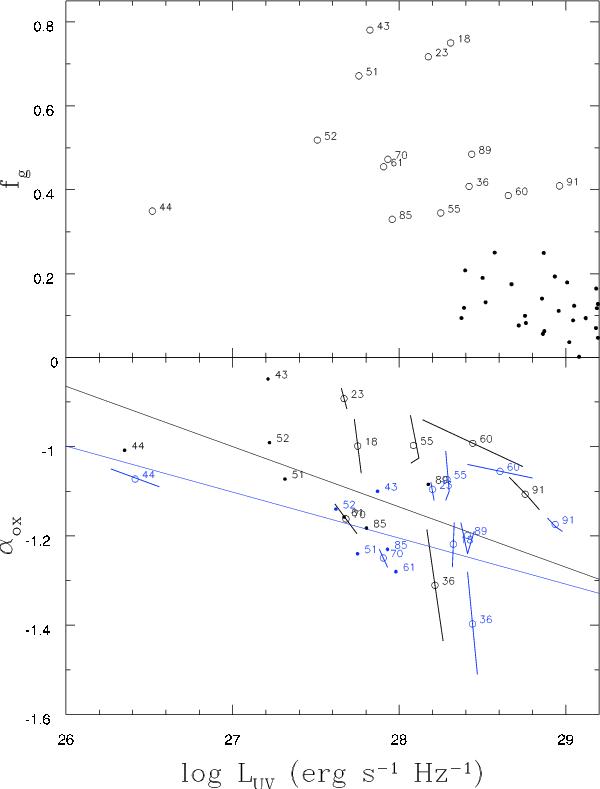
Effect of the dilution by the host galaxy. Upper panel: galactic fraction fg as a function of the UV luminosity; sources with fg > 30% are represented by circles and are numbered, sources with fg < 30% are shown as dots. Lower panel: the αox − LUV relation before (blue) and after (black) correction for galaxy dilution. Only the most diluted sources are shown, all shifted along lines with slope −0.384, by amounts increasing with fg. Sources 44 and 89 have a reduced number of epochs after correction, due to the requirement that the SED contains at least four UVOT points, as discussed in Sect. 2.1.
Current usage metrics show cumulative count of Article Views (full-text article views including HTML views, PDF and ePub downloads, according to the available data) and Abstracts Views on Vision4Press platform.
Data correspond to usage on the plateform after 2015. The current usage metrics is available 48-96 hours after online publication and is updated daily on week days.
Initial download of the metrics may take a while.