Fig. 1
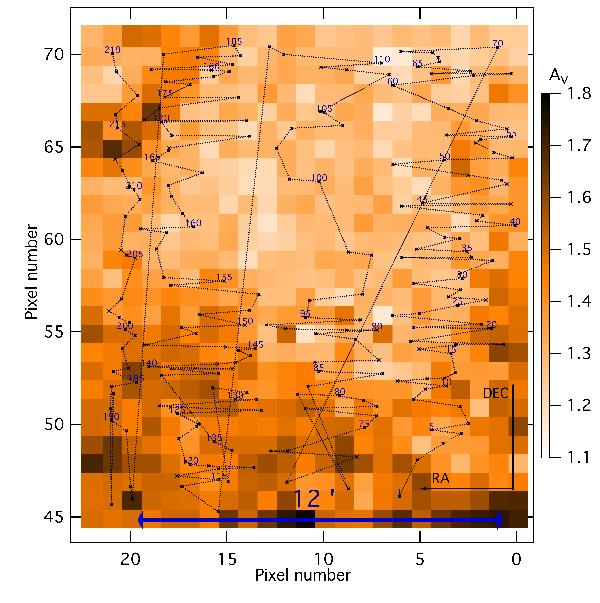
Target stars used in this study (black crosses) superimposed on the extinction map from Sumi (2004). The map is centered on (l, b) = (0.8, − 4). Each pixel is 0.6′ × 0.6′. The extinction scale is displayed in Fig. 14. Stars are numbered according to Table 3. Dotted lines link stars in increasing order of their ID number. Only one out of five numbers is indicated for clarity.
Current usage metrics show cumulative count of Article Views (full-text article views including HTML views, PDF and ePub downloads, according to the available data) and Abstracts Views on Vision4Press platform.
Data correspond to usage on the plateform after 2015. The current usage metrics is available 48-96 hours after online publication and is updated daily on week days.
Initial download of the metrics may take a while.