Fig. 7
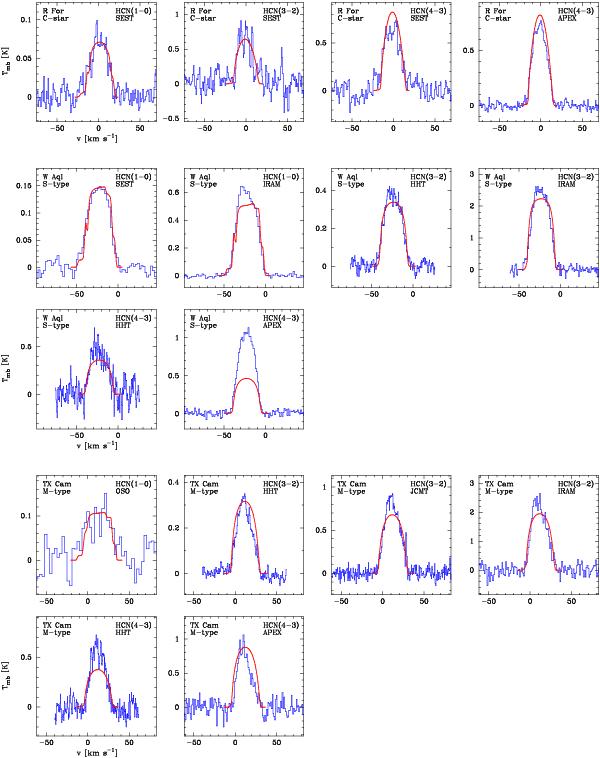
Multi-transition spectra (histograms) of HCN line emission (HHT data from Bieging et al. 2000), overlaid by spectra from the best-fit model (solid lines; assuming a Guassian abundance distribution), towards top panels – the carbon star R For using a fractional HCN abundance f0 = 4.0 × 10⁻⁵ and an envelope size re = 9.3 × 1015 cm. Middle panels – S-type AGB star W Aql using a fractional HCN abundance f0 = 1.2 × 10⁻⁶ and an envelope size re = 1.3 × 1016 cm. Bottom panels – M-type AGB star TX Cam using a fractional HCN abundance f0 = 3.5 × 10⁻⁷ and an envelope size re = 2.0 × 1016 cm are also shown (solid lines). The hyperfine splitting of the J = 1 → 0 transition significantly broadens the line. This effect is explicitly taken into account in the modelling. The calibration uncertainty in the observed spectra is ≈±20%.
Current usage metrics show cumulative count of Article Views (full-text article views including HTML views, PDF and ePub downloads, according to the available data) and Abstracts Views on Vision4Press platform.
Data correspond to usage on the plateform after 2015. The current usage metrics is available 48-96 hours after online publication and is updated daily on week days.
Initial download of the metrics may take a while.