Fig. 1
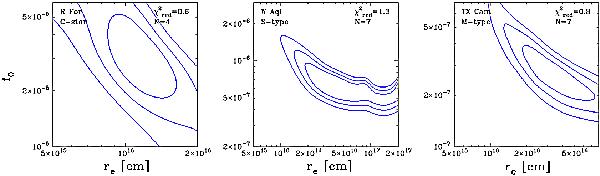
χ2-map showing the quality of the fit to available HCN multi-transition single-dish data for the AGB stars R For (left panel), W Aql (middle panel), and TX Cam (right panel) when varying the adjustable parameters, f0 and re, in the model. Contours are drawn at the 1, 2, and 3σ levels. Indicated in the upper right corner is the reduced χ2 of the best-fit model and the number of observational constraints used, N.
Current usage metrics show cumulative count of Article Views (full-text article views including HTML views, PDF and ePub downloads, according to the available data) and Abstracts Views on Vision4Press platform.
Data correspond to usage on the plateform after 2015. The current usage metrics is available 48-96 hours after online publication and is updated daily on week days.
Initial download of the metrics may take a while.