Fig. 5
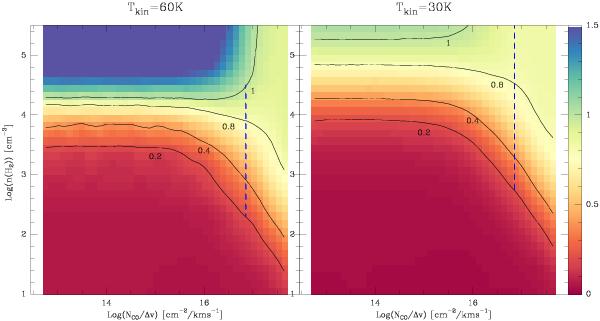
Peak Tb ratio between the CO(4–3) and CO(2–1) lines versus H2 density, and the CO column density per unit velocity width (NCO/ΔV) for two values of the kinetic temperature: Tk = 60 K, the dust temperature (left), and Tk = 30 K (right). The black contours are underlining the values obtained in the data. In both panels, the vertical line corresponding to (NCO/ΔV) = 7 × 1016 cm-2/(kms-1), value chosen in Table 4, has been emphasized with blue dashes. The predictions come from the LVG models that are part of the Radex code (van der Tak 2007).
Current usage metrics show cumulative count of Article Views (full-text article views including HTML views, PDF and ePub downloads, according to the available data) and Abstracts Views on Vision4Press platform.
Data correspond to usage on the plateform after 2015. The current usage metrics is available 48-96 hours after online publication and is updated daily on week days.
Initial download of the metrics may take a while.