Free Access
Fig. A.1
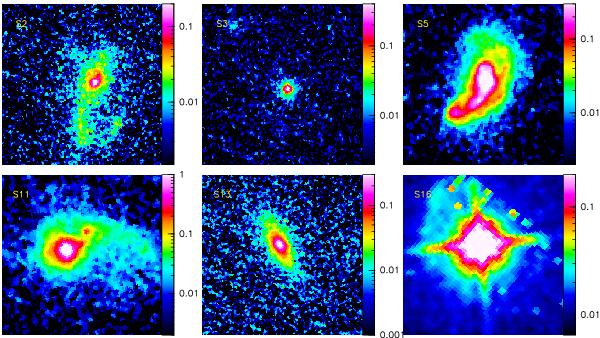
Optical red (F814W) HST-ACS images of six more sources. Only S16 is detected in the CO line. Each panel is 5″ × 5″ in size, and is centered on the galaxy coordinates of Table 1. The brightness scale is logarithmic. North is up and east to the left in all panels.
Current usage metrics show cumulative count of Article Views (full-text article views including HTML views, PDF and ePub downloads, according to the available data) and Abstracts Views on Vision4Press platform.
Data correspond to usage on the plateform after 2015. The current usage metrics is available 48-96 hours after online publication and is updated daily on week days.
Initial download of the metrics may take a while.