Fig. 12
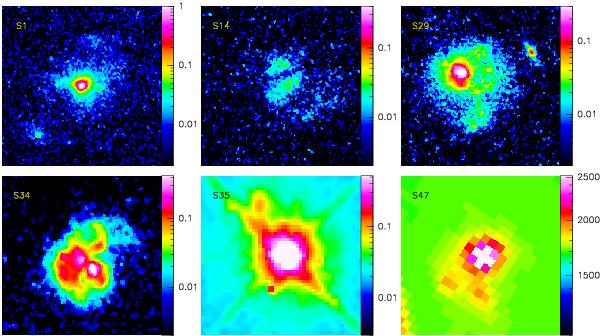
Optical or NIR images from HST. Most images are ACS-F814W, except S35 (WFPC2-702W) and S47 (WFC3-160W). All sources are detected in CO. Each panel is 5″ × 5″ in size, and is centered on the galaxy coordinates given in Table 1. The brightness scale is logarithmic (except for S47). North is up and east to the left in all panels. S14, S29, S34 and S47 were classified as strongly interacting, while S1 and S35 are weakly interacting.
Current usage metrics show cumulative count of Article Views (full-text article views including HTML views, PDF and ePub downloads, according to the available data) and Abstracts Views on Vision4Press platform.
Data correspond to usage on the plateform after 2015. The current usage metrics is available 48-96 hours after online publication and is updated daily on week days.
Initial download of the metrics may take a while.