Free Access
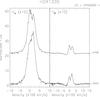
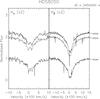
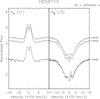
Fig. B.1
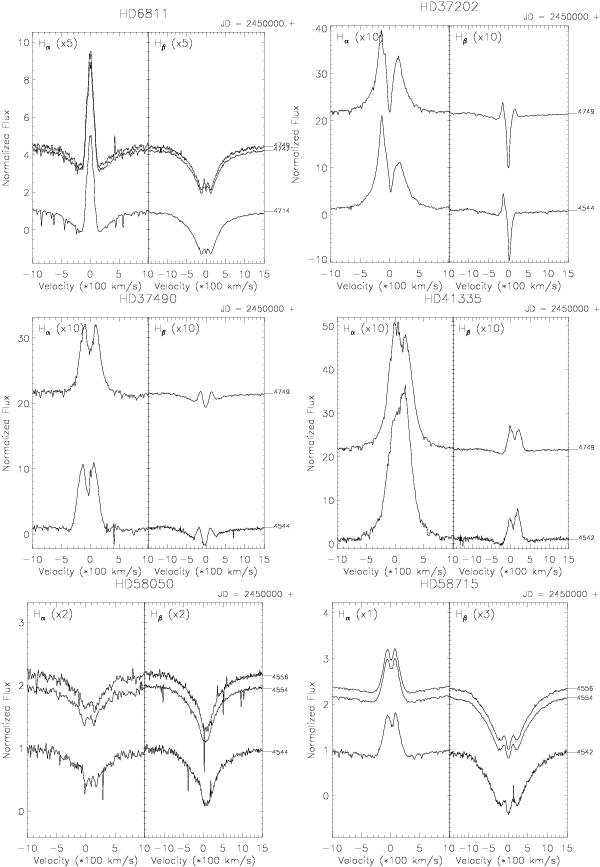
Line profiles of Hα and Hβ observed for our program stars. Spectra have been shifted along the vertical axis according to the Julian Day of their observation, whose last four digits are reported. In parenthesis we report the magnification factors applied to each profiles in order to improve the visualization.
This figure is made of several images, please see below:
Current usage metrics show cumulative count of Article Views (full-text article views including HTML views, PDF and ePub downloads, according to the available data) and Abstracts Views on Vision4Press platform.
Data correspond to usage on the plateform after 2015. The current usage metrics is available 48-96 hours after online publication and is updated daily on week days.
Initial download of the metrics may take a while.