Fig. A.3
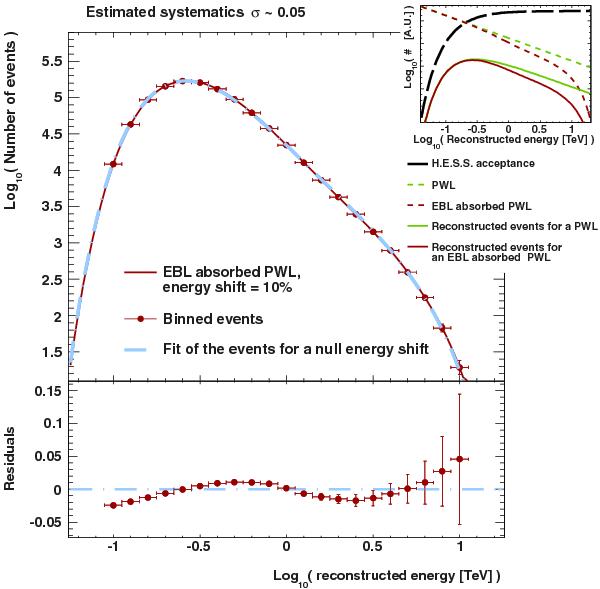
Toy-model of the energy distribution of H.E.S.S. events. The inset in the top panel shows the detector acceptance (black line) and the expected distributions of events for a PWL and an EBL absorbed PWL (green and brown lines, respectively). The injected spectra are shifted in energy to model the absorption of Cherenkov light by the atmosphere yielding the distribution of events shown in the top panel with brown filled circles. Fitting this distribution with a non shifted model enables the characterization of the atmospheric impact on the EBL normalization estimated to 0.05 for an energy shift of 10%. The residuals of the fit are shown in the bottom panel.
Current usage metrics show cumulative count of Article Views (full-text article views including HTML views, PDF and ePub downloads, according to the available data) and Abstracts Views on Vision4Press platform.
Data correspond to usage on the plateform after 2015. The current usage metrics is available 48-96 hours after online publication and is updated daily on week days.
Initial download of the metrics may take a while.