Fig. A.2
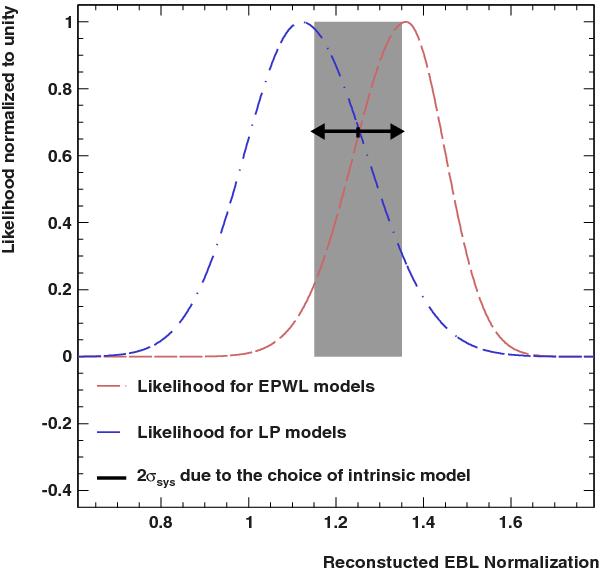
Likelihood profiles as a function of the normalized EBL opacity. The profiles were normalized to unity for clarity purposes. The dotted dashed curve is derived fitting log-parabolic intrinsic spectra to the data sets, while the dashed curve is derived by fitting exponential cut-off models. The gap between the two profiles due to the intrinsic spectral modelling is represented by the grey shaded area and the double arrow.
Current usage metrics show cumulative count of Article Views (full-text article views including HTML views, PDF and ePub downloads, according to the available data) and Abstracts Views on Vision4Press platform.
Data correspond to usage on the plateform after 2015. The current usage metrics is available 48-96 hours after online publication and is updated daily on week days.
Initial download of the metrics may take a while.