Fig. A.1
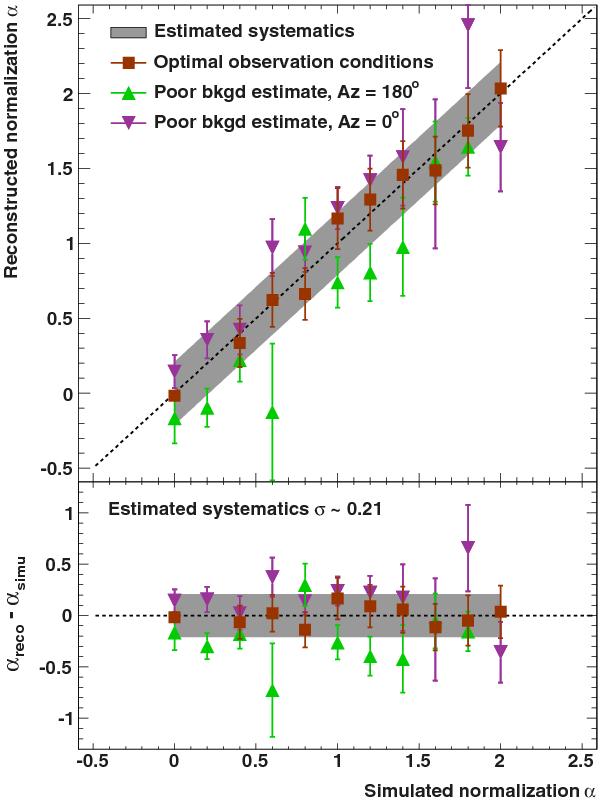
Reconstruction of the EBL normalization with Monte Carlo simulated air showers passing through the analysis chain. Three samples of Monte Carlo events are represented: the first one (orange squares) corresponds to the observation conditions of PKS 2155 - 304, the second and third (triangles) correspond to a poor background estimation. These two last sets were used to estimate the systematic uncertainty represented with the grey shaded area. Top panel: reconstructed EBL normalization as a function of the simulated normalization. Bottom panel: residuals, defined as the difference between the reconstructed and simulated optical depth normalizations.
Current usage metrics show cumulative count of Article Views (full-text article views including HTML views, PDF and ePub downloads, according to the available data) and Abstracts Views on Vision4Press platform.
Data correspond to usage on the plateform after 2015. The current usage metrics is available 48-96 hours after online publication and is updated daily on week days.
Initial download of the metrics may take a while.