Fig. 5
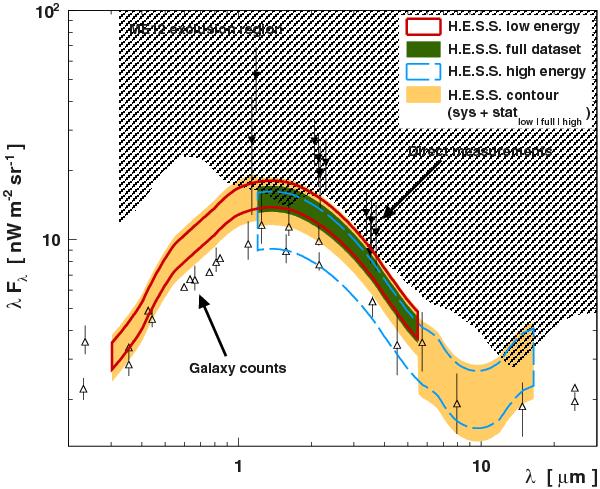
Flux density of the extragalactic background light versus wavelength. The 1σ (statistical) contours derived for several energy ranges are described in the top-right legend. The systematic uncertainty is added quadratically to the statistical one to derive the H.E.S.S. contour. Lower limits based on galaxy counts and direct measurements are respectively shown with empty upward and filled downward pointing triangles (extracted from Gilmore et al. 2012). The region excluded by Meyer et al. (2012) with VHE spectra is represented by the dashed area.
Current usage metrics show cumulative count of Article Views (full-text article views including HTML views, PDF and ePub downloads, according to the available data) and Abstracts Views on Vision4Press platform.
Data correspond to usage on the plateform after 2015. The current usage metrics is available 48-96 hours after online publication and is updated daily on week days.
Initial download of the metrics may take a while.