Fig. 4
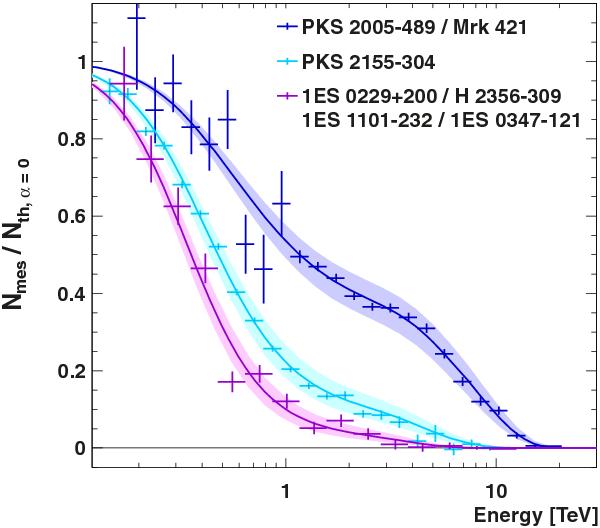
Observed number of γ-rays over number of events expected from the intrinsic spectra vs. γ-ray energy. The data sets are grouped by similar redshift and the detected and expected numbers of γ-rays are summed in each energy bin. The best fit EBL absorption is represented by the solid lines for the three redshifts corresponding to the groups of data sets and the shaded areas correspond to the ± 1σ best fit EBL normalization.
Current usage metrics show cumulative count of Article Views (full-text article views including HTML views, PDF and ePub downloads, according to the available data) and Abstracts Views on Vision4Press platform.
Data correspond to usage on the plateform after 2015. The current usage metrics is available 48-96 hours after online publication and is updated daily on week days.
Initial download of the metrics may take a while.