Fig. 3
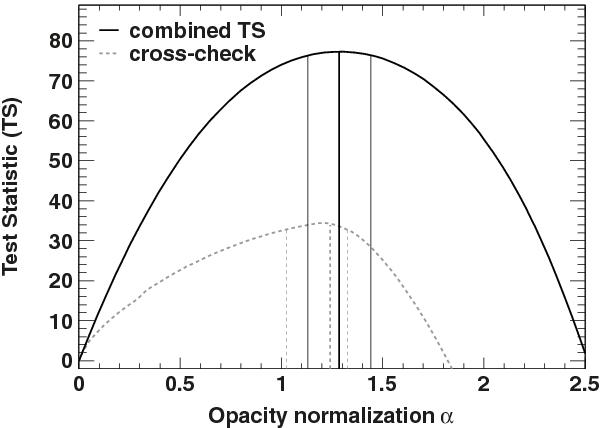
Combined test statistic as a function of the normalized EBL optical depth. The results obtained with the Model analysis are shown with a black line and the cross-check led with the MVA analysis is shown with the dashed grey line. The best fit value and 1σ statistical uncertainties are shown with the vertical lines.
Current usage metrics show cumulative count of Article Views (full-text article views including HTML views, PDF and ePub downloads, according to the available data) and Abstracts Views on Vision4Press platform.
Data correspond to usage on the plateform after 2015. The current usage metrics is available 48-96 hours after online publication and is updated daily on week days.
Initial download of the metrics may take a while.