Fig. 10
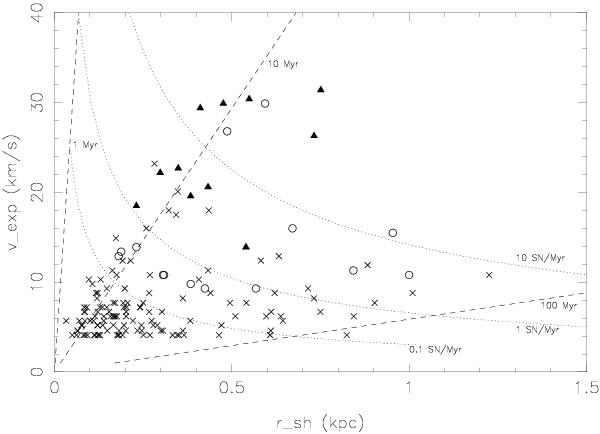
rv diagram of supershells. Evolutionary lines (Weaver et al. 1977) for three luminosities are overlaid (dotted lines), as well as three lines of different times (dashed lines), for the density n0 = 0.3 cm-3. Different symbols denote estimated energy inputs to shells, when densities from Kalberla & Dedes (2008) are taken into account (see text for the explanation): crosses for L < 0.1 SN Myr-1, open circles for 0.1 SN Myr-1 ≤ L ≤ 1.0 SN Myr-1, triangles for L > 1.0 SN Myr-1.
Current usage metrics show cumulative count of Article Views (full-text article views including HTML views, PDF and ePub downloads, according to the available data) and Abstracts Views on Vision4Press platform.
Data correspond to usage on the plateform after 2015. The current usage metrics is available 48-96 hours after online publication and is updated daily on week days.
Initial download of the metrics may take a while.