Fig. 5
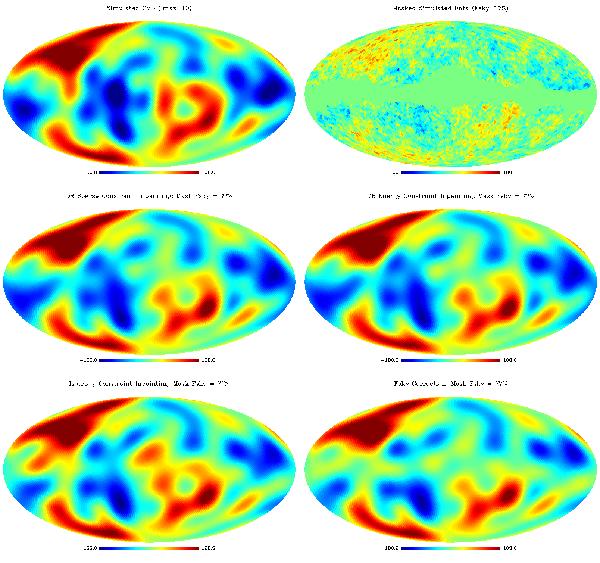
Top: input-smoothed simulated CMB map (ℓmax = 10) and the same map, but masked (Fsky = 77%) and not smoothed (i.e., input-simulated data). Middle: inpainting of the top right image up to ℓmax = 10, using a sparsity prior (left) and an energy prior (right). Bottom: inpainting of the top right image up to ℓmax = 10, using an isotropy prior (left) and a simple Fsky correction (right).
Current usage metrics show cumulative count of Article Views (full-text article views including HTML views, PDF and ePub downloads, according to the available data) and Abstracts Views on Vision4Press platform.
Data correspond to usage on the plateform after 2015. The current usage metrics is available 48-96 hours after online publication and is updated daily on week days.
Initial download of the metrics may take a while.