Fig. 22
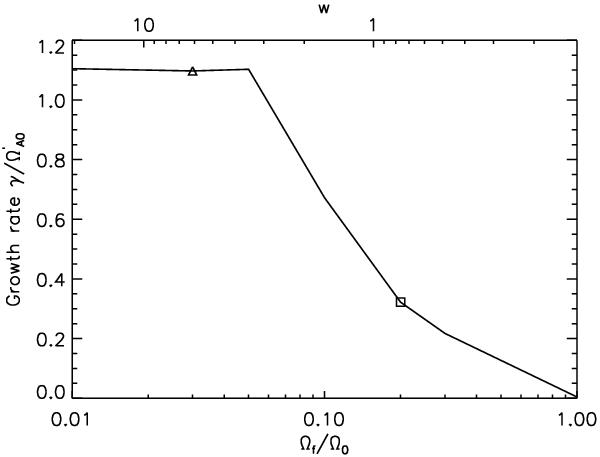
Growth rate γ as a function of the slow-down ratio Ωf/Ω.  represents the averaged Alfvén frequency at the moment when the slow-down begins, i.e. at the time t′. The square and the triangle mark Ωf/Ω of the snapshots from Fig. 21 (top and bottom respectively). The upper abscissa represents the averaged value w which is reached as the result of the slow-down.
Current usage metrics show cumulative count of Article Views (full-text article views including HTML views, PDF and ePub downloads, according to the available data) and Abstracts Views on Vision4Press platform.
Data correspond to usage on the plateform after 2015. The current usage metrics is available 48-96 hours after online publication and is updated daily on week days.
Initial download of the metrics may take a while.