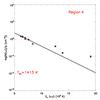
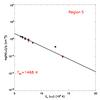
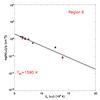
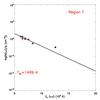
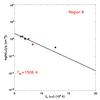
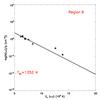
Fig. 8
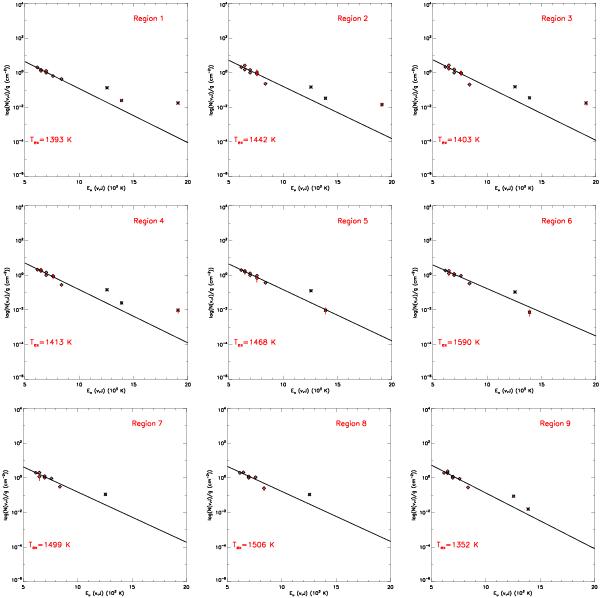
Excitation diagrams of observed H2 line column density distribution as a function of upper energy level. The column density is normalized to the 1-0 S(1) H2 transition. Diamonds represent lines from v = 1 while the asterisks represent points from v > 1. The solid line is a best fit of the Boltzmann distribution to the v = 1 points, the slope represents the excitation temperature, Tex. Each panel represents a different region, corresponding to the regions in Fig. 5. The error bars represent a standard deviation from the column density.
Current usage metrics show cumulative count of Article Views (full-text article views including HTML views, PDF and ePub downloads, according to the available data) and Abstracts Views on Vision4Press platform.
Data correspond to usage on the plateform after 2015. The current usage metrics is available 48-96 hours after online publication and is updated daily on week days.
Initial download of the metrics may take a while.