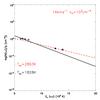
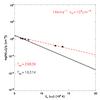
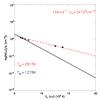
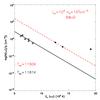
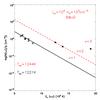
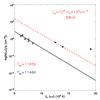
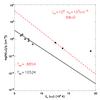
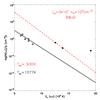
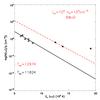
Fig. 7
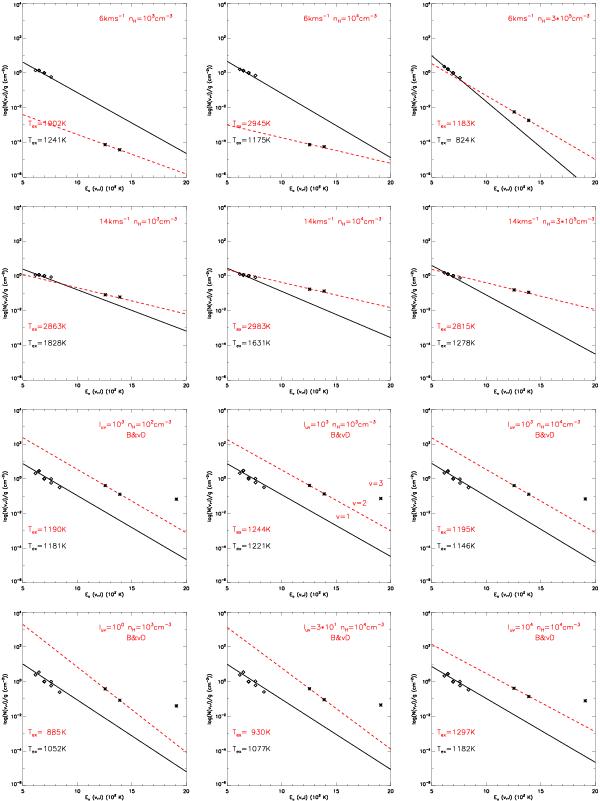
Excitation diagrams of shock and PDR model-predicted H2 line column density distributions as a function of upper energy level. The column density is normalized to the 1-0 S(1) H2 transition. Diamonds represent lines from v = 1 while the asterisks represent points from v > 1. The solid line is a best fit of the Boltzmann distribution to the v = 1 points, the slope represents the excitation temperature, Tex. Predictions of shock models from Shull & Hollenbach (1978) with shock speeds 6 km s-1 (top row) and 14 km s-1 (second row) and densities nH = 103 cm-3 (left), 104 cm-3 (middle), and 105 cm-3 (right). Predictions of PDR models from Black & van Dishoeck (1987) with Iuv = 100 − 104 and densities nH = 103 cm-3, 104 cm-3, and 105 cm-3, and are labeled with BvD.
Current usage metrics show cumulative count of Article Views (full-text article views including HTML views, PDF and ePub downloads, according to the available data) and Abstracts Views on Vision4Press platform.
Data correspond to usage on the plateform after 2015. The current usage metrics is available 48-96 hours after online publication and is updated daily on week days.
Initial download of the metrics may take a while.