Fig. 6
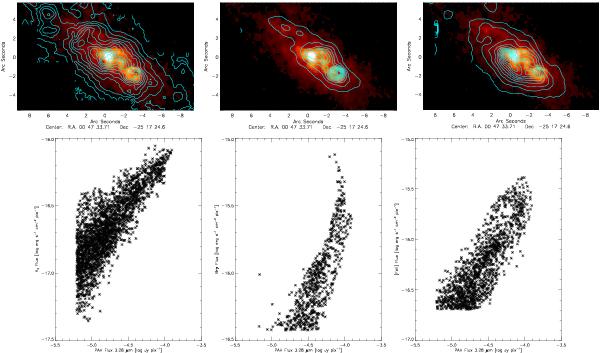
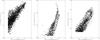
Top panels: PAH 3.28 μm continuum subtracted image from ISAAC. Left panel has H2 1-0 S(1) contours, middle panel has Brγ contours, right panel has [FeII]1.64 contours. The offset from the kinematic center at position  is given on each axis. The kinematic center is from Müller-Sánchez et al. (2010). Bottom panels: pixel-pixel plots of PAH flux vs. H2 flux (left), Brγ flux (center), and [FeII] flux (right). The pixels of the ISAAC PAH observations were rebinned to match those of the SINFONI observations.
Current usage metrics show cumulative count of Article Views (full-text article views including HTML views, PDF and ePub downloads, according to the available data) and Abstracts Views on Vision4Press platform.
Data correspond to usage on the plateform after 2015. The current usage metrics is available 48-96 hours after online publication and is updated daily on week days.
Initial download of the metrics may take a while.