Fig. 5
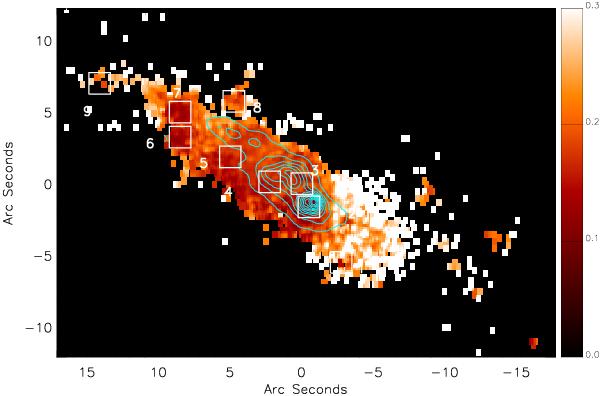
The ratio of 2-1 S(1)/1-0 S(1) H2 lines with the Brγ line map over plotted in contours. The white rectangles are the same regions as defined in Fig. 1. The color bar values represent the value of the ratio. The offset from the kinematic center at position  is given on each axis. Ratio values where the line flux of either transition is below 10% of the maximum flux of that line are masked.
Current usage metrics show cumulative count of Article Views (full-text article views including HTML views, PDF and ePub downloads, according to the available data) and Abstracts Views on Vision4Press platform.
Data correspond to usage on the plateform after 2015. The current usage metrics is available 48-96 hours after online publication and is updated daily on week days.
Initial download of the metrics may take a while.