Fig. 4
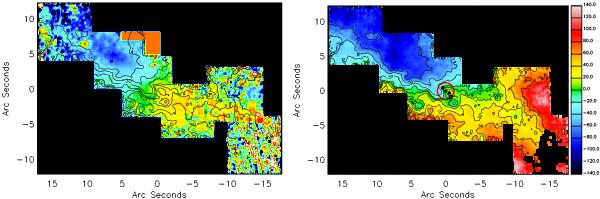
Stellar velocity field (left) with H2 1-0 S(1) velocity contours and H2 1-0 S(1) velocity map with contours (right). The contour levels are − 75, − 50, − 30, − 10,0,10,30,50,75 km s-1. The color bar describes the H2 and stellar velocity in km s-1. On the right panel, the red circle represents the 3σ uncertainty for the center defined by Müller-Sánchez et al. (2010). The plus sign is the center of this circle, and the kinematic center. The diamond is TH2, the radio peak. The triangle is X-1, the X-ray peak. The square is the point of highest symmetry.
Current usage metrics show cumulative count of Article Views (full-text article views including HTML views, PDF and ePub downloads, according to the available data) and Abstracts Views on Vision4Press platform.
Data correspond to usage on the plateform after 2015. The current usage metrics is available 48-96 hours after online publication and is updated daily on week days.
Initial download of the metrics may take a while.