Fig. 3
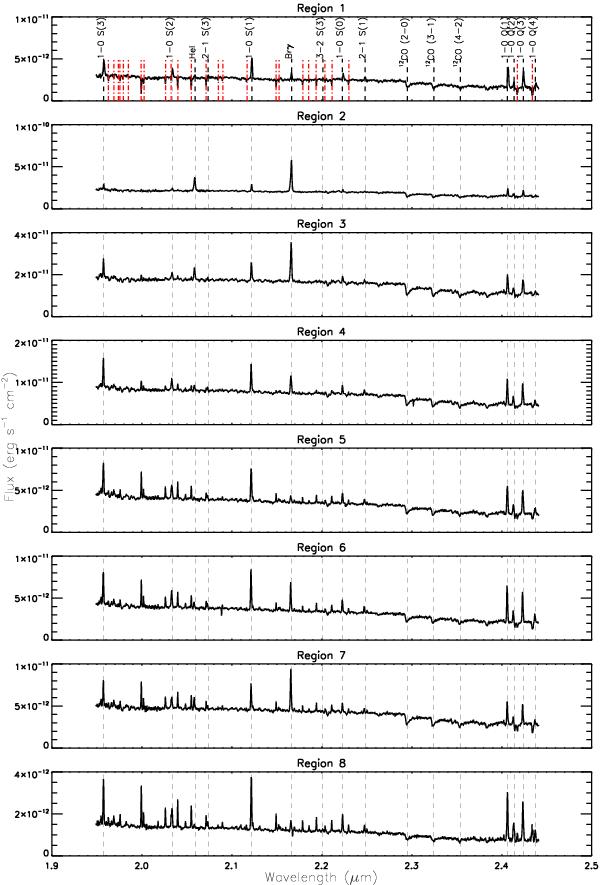
K band spectra of H2 bright clumps. The integrated K band spectra, in the rest frame, integrated over the regions shown in Fig. 1. Vertical dotted lines are used to show dominant emission lines. The strongest OH lines have been marked in the spectrum of Region 1 with the red dot-dash line. The 12CO absorption bands are also visible at 2.294, 2.323, and 2.353 μm respectively. Region 2 is the K Continuum peak and hot spot, Region 3 is the kinematic nucleus, and Region 4 is the H2 emission peak.
Current usage metrics show cumulative count of Article Views (full-text article views including HTML views, PDF and ePub downloads, according to the available data) and Abstracts Views on Vision4Press platform.
Data correspond to usage on the plateform after 2015. The current usage metrics is available 48-96 hours after online publication and is updated daily on week days.
Initial download of the metrics may take a while.