Fig. 2
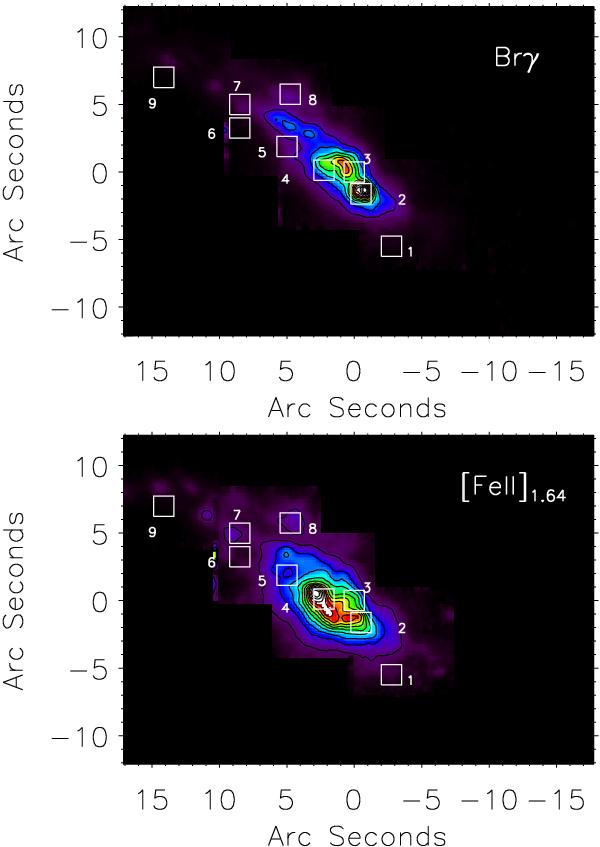
Brγ and [FeII]1.64 emission line map of NGC 253. The offset from the kinematic center at position  is given on each axis. The contours represent 13 equally spaced levels with a maximum flux of 4.5 × 10⁻¹⁴ and 2.8 × 10⁻¹⁴ erg s-1 cm-2 arcsec-2 for Brγ and [FeII] respectively. The white rectangular regions are areas of concentrated H2 flux, with the exception of Region 3, which is centered on the kinematic center.
Current usage metrics show cumulative count of Article Views (full-text article views including HTML views, PDF and ePub downloads, according to the available data) and Abstracts Views on Vision4Press platform.
Data correspond to usage on the plateform after 2015. The current usage metrics is available 48-96 hours after online publication and is updated daily on week days.
Initial download of the metrics may take a while.