Fig. 7
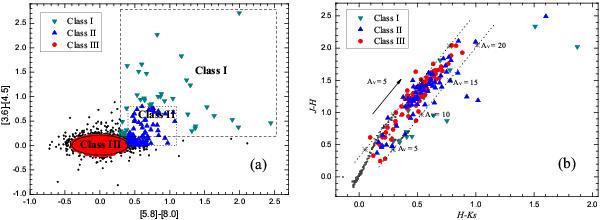
a) GLIMPSE CC diagram [5.8]−[8.0] versus [3.6]−[4.5] for sources within a circle of about 10′ in radius centered on N131. The classification of class I, II, and III indicates different stellar evolutionary stages as defined by Allen et al. (2004). b) 2MASS CC diagram (H − Ks) versus (J − H). The sources for classes I and II are these, detected simultaneously by J, H, Ks, 3.6, 4.5, 5.8, and 8.0 μ bands; the sources for class III are located within a circle of 2.60′ (0.5 × rin) in a radius centered on N131. The gray squares represent the location of the main sequence and the giant stars (Bessell & Brett 1988). The parallel dotted lines are reddening vectors. The adopted interstellar reddening law is AJ / AV = 0.282, AH / AV = 0.175, and AKs / AV = 0.112 (Rieke & Lebofsky 1985), and the intrinsic colors (H − Ks)0 and (J − H)0 are obtained from Martins & Plez (2006).
Current usage metrics show cumulative count of Article Views (full-text article views including HTML views, PDF and ePub downloads, according to the available data) and Abstracts Views on Vision4Press platform.
Data correspond to usage on the plateform after 2015. The current usage metrics is available 48-96 hours after online publication and is updated daily on week days.
Initial download of the metrics may take a while.