Fig. 5
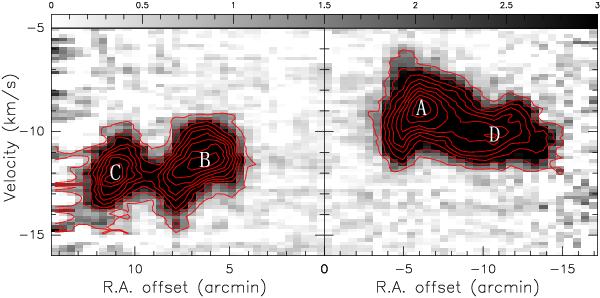
Position-velocity diagram of the 12CO emission clouds along the white
straight lines in Fig. 2. The position
corresponding to offset 0 is at RA(J2000) =
19h52m17 7,
Dec(J2000) = +26°22′05
7,
Dec(J2000) = +26°22′05 8. The
position angle of clump BC is positive, and that of clump AD is negative. The
contour levels rang from 0.97 to 8.72 by 0.97 K for the left panel,
while from 1.23 to 11.07 by 1.23 K for the right panel. The color
bar of the grayscale for the 12CO emission is above the diagram. The
letters A, B, C, and D correspond to the positions of the same letters as in
Fig. 2.
8. The
position angle of clump BC is positive, and that of clump AD is negative. The
contour levels rang from 0.97 to 8.72 by 0.97 K for the left panel,
while from 1.23 to 11.07 by 1.23 K for the right panel. The color
bar of the grayscale for the 12CO emission is above the diagram. The
letters A, B, C, and D correspond to the positions of the same letters as in
Fig. 2.
Current usage metrics show cumulative count of Article Views (full-text article views including HTML views, PDF and ePub downloads, according to the available data) and Abstracts Views on Vision4Press platform.
Data correspond to usage on the plateform after 2015. The current usage metrics is available 48-96 hours after online publication and is updated daily on week days.
Initial download of the metrics may take a while.