Fig. 4
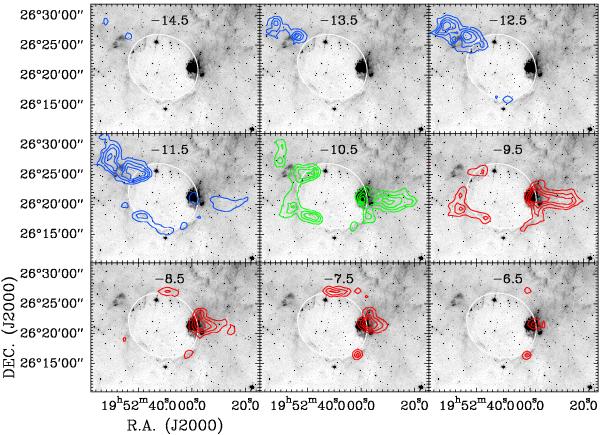
Integrated intensity contours of the 12CO emission clouds every 1.0 km s-1 superimposed on the GLIMPSE 8.0 μm grayscale. The lowest contour level for each velocity panel from −14.5 to −6.5 km s-1 is 1.59, 1.37, 1.80, 2.24, 1.96, 2.19, 2.80, 1.22, and 0.95 K km s-1, respectively; the level increment of each panel is equal to the corresponding value of the lowest contour level. The blue, green, and red contours indicate the blueshifted, systematic, and redshifted velocities, respectively. The white ellipse indicates the position of bubble N131.
Current usage metrics show cumulative count of Article Views (full-text article views including HTML views, PDF and ePub downloads, according to the available data) and Abstracts Views on Vision4Press platform.
Data correspond to usage on the plateform after 2015. The current usage metrics is available 48-96 hours after online publication and is updated daily on week days.
Initial download of the metrics may take a while.