Fig. 3
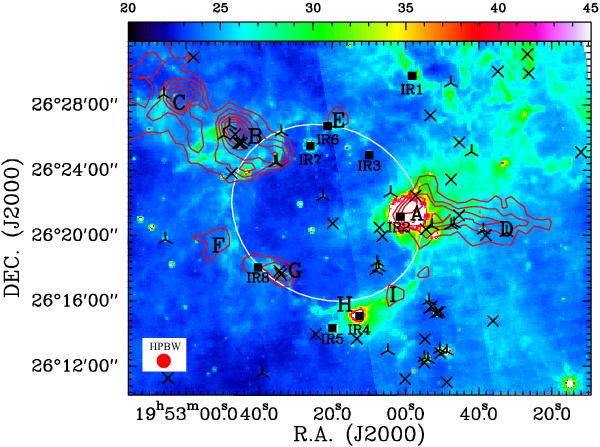
Integrated intensity contours of the 13CO emission clouds superimposed on the MIPSGAL 24 μm colorscale. The contour levels range from 2.17 to 8.68 by 1.09 K km s-1. The integration range is from −14.5 to −6.5 km s-1. The letters from A to I indicate the positions of nine molecular clumps, and the symbols “”, “ × ”, and “■” indicate the positions of class I, class II, and IRAS point sources, respectively. The white ellipse indicates the position of bubble N131. The beam size of 12CO emission is given in the filled red circle. The unit of the color bar is in MJy sr-1.
Current usage metrics show cumulative count of Article Views (full-text article views including HTML views, PDF and ePub downloads, according to the available data) and Abstracts Views on Vision4Press platform.
Data correspond to usage on the plateform after 2015. The current usage metrics is available 48-96 hours after online publication and is updated daily on week days.
Initial download of the metrics may take a while.