Free Access
Fig. 8
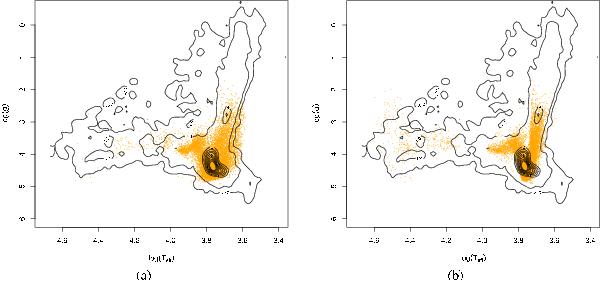
Contour density plot of the Teff – log (g) predictions in the PASTEL catalogue (Soubiran et al. 2010) with our KT (left) and ELODIE (right) predictions for the CoRoT targets observed with the Giraffe spectrograph superimposed as orange dots.
Current usage metrics show cumulative count of Article Views (full-text article views including HTML views, PDF and ePub downloads, according to the available data) and Abstracts Views on Vision4Press platform.
Data correspond to usage on the plateform after 2015. The current usage metrics is available 48-96 hours after online publication and is updated daily on week days.
Initial download of the metrics may take a while.