Fig. 3
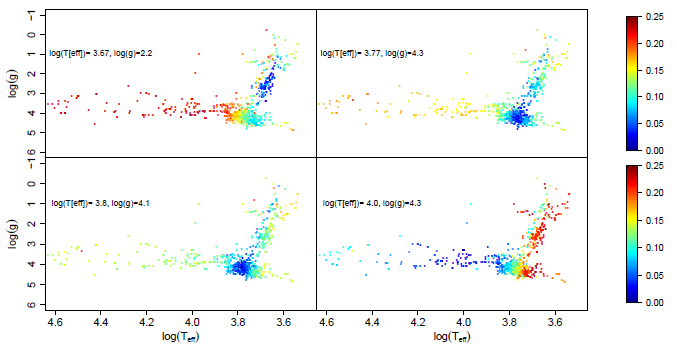
Differences between four selected ELODIE spectra (indexed by the stellar parameters shown in each panel) and the ELODIE spectral collection. The panels show an approximation to the expected degeneracies in the mapping between spectra and physical parameters. The colour code represents the area of the (absolute value of the) difference between two pairs of spectra, where each spectrum has been normalised to area 1, as described in the text.
Current usage metrics show cumulative count of Article Views (full-text article views including HTML views, PDF and ePub downloads, according to the available data) and Abstracts Views on Vision4Press platform.
Data correspond to usage on the plateform after 2015. The current usage metrics is available 48-96 hours after online publication and is updated daily on week days.
Initial download of the metrics may take a while.