Fig. 22
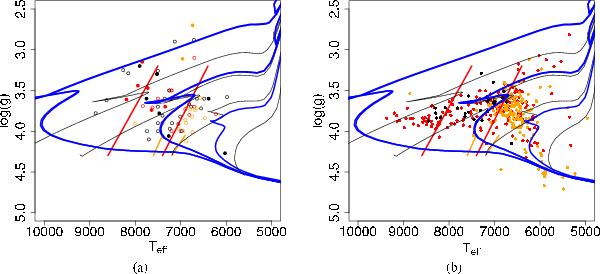
δ Sct (red), γ Dor (orange), and hybrid (black) candidate stars in the Teff – log (g) plane. The left-hand diagram shows the distribution of Kepler candidates according to Uytterhoeven et al. (2011). We show only values derived from spectroscopy and with uncertainties in the effective temperatures below 100 K (filled circles) or below 240 K (empty symbols). The right-hand plot corresponds to our determination of the parameters for CoRoT candidates. Black continuous lines represent evolutionary tracks for stars with M/M⊙ = 2.5, 2.0, 1.5 and 1.0 and Z = 0.019 from Marigo et al. (2008). The thick straight lines represent the instability regions for δ Sct-type pulsation (red) from Rodríguez & Breger (2001) and for γ Dor-type pulsation (orange) from Handler & Shobbrook (2002). The blue thick lines represent isochrones from the same set of evolutionary tracks for ages log (t /yrs) = 8.5, 9.0, and 9.5 dex.
Current usage metrics show cumulative count of Article Views (full-text article views including HTML views, PDF and ePub downloads, according to the available data) and Abstracts Views on Vision4Press platform.
Data correspond to usage on the plateform after 2015. The current usage metrics is available 48-96 hours after online publication and is updated daily on week days.
Initial download of the metrics may take a while.