Fig. 20
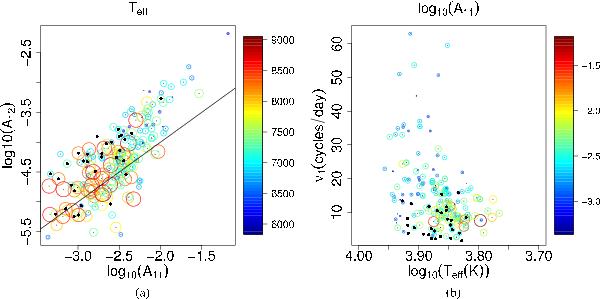
Distribution of amplitudes in the category of δ Sct candidates. The left-hand plot shows the distribution of the amplitudes of the first two terms in the Fourier decomposition of the first frequency in logarithmic scale. The colour code and circles radii represent the effective temperature. The right-hand plot shows the distribution of amplitudes of the first Fourier component of the first frequency as a function of the position in the log 10(Teff)–ν1 plane. Black circles represent hybrid pulsators.
Current usage metrics show cumulative count of Article Views (full-text article views including HTML views, PDF and ePub downloads, according to the available data) and Abstracts Views on Vision4Press platform.
Data correspond to usage on the plateform after 2015. The current usage metrics is available 48-96 hours after online publication and is updated daily on week days.
Initial download of the metrics may take a while.