Free Access
Fig. 19
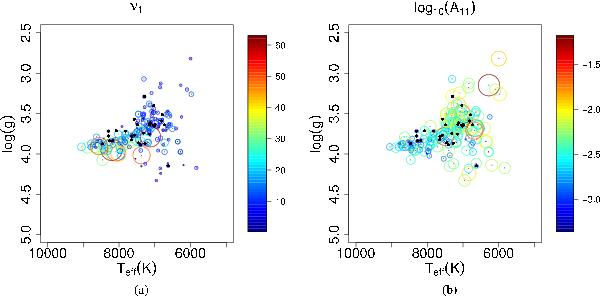
δ Sct candidates in the Teff − log (g) plane. The frequency (measured in cycles per day; left) and the base-10 logarithm of the amplitude of the first term in its Fourier decomposition (right) are represented using the colour codes shown at the right of each plot, and circles of radii proportional to the value.
Current usage metrics show cumulative count of Article Views (full-text article views including HTML views, PDF and ePub downloads, according to the available data) and Abstracts Views on Vision4Press platform.
Data correspond to usage on the plateform after 2015. The current usage metrics is available 48-96 hours after online publication and is updated daily on week days.
Initial download of the metrics may take a while.