Fig. 9
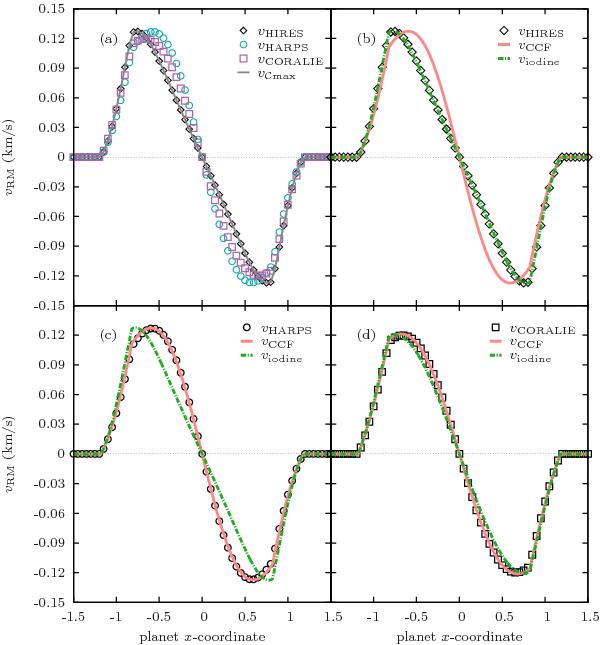
Comparison of a simulated RM signal observed by different techniques and/or
instruments. We used the line profiles of Fig. 8b. The open diamonds, circles and squares represent the RM signal
obtained numerically with the iodine cell technique on the HIRES line profile, and
with the Gaussian fit to the HARPS, or CORALIE, CCFs, respectively. In a)
the gray curve corresponds to the numerical maximization of the
cross-correlation  of the HIRES profiles inside and outside transits. In b),
c), and d), the numerical RM signal computed on the
HIRES, HARPS, and CORALIE line profiles, respectively, are compared with the
analytical formulas vCCF (14) in solid red and viodine (27) in dash-dotted green.
of the HIRES profiles inside and outside transits. In b),
c), and d), the numerical RM signal computed on the
HIRES, HARPS, and CORALIE line profiles, respectively, are compared with the
analytical formulas vCCF (14) in solid red and viodine (27) in dash-dotted green.
Current usage metrics show cumulative count of Article Views (full-text article views including HTML views, PDF and ePub downloads, according to the available data) and Abstracts Views on Vision4Press platform.
Data correspond to usage on the plateform after 2015. The current usage metrics is available 48-96 hours after online publication and is updated daily on week days.
Initial download of the metrics may take a while.