Fig. 8
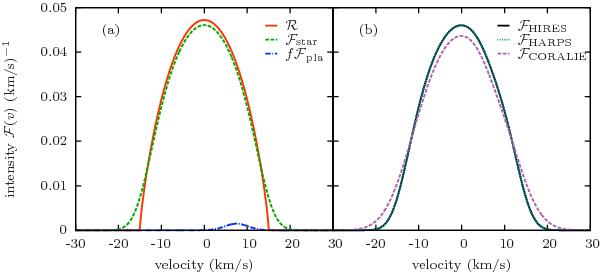
Simple models of line profiles. a) Rotation kernel ℛ(v) with Vsini⋆ = 15 km s-1 in solid red, stellar line profile assuming β0 = 2.6 km s-1 in dashed green, subplanet line profile ℱpla(v) with βp = 2.71 km s-1 in dash-dotted blue. b) ℱtransit = ℱstar − fℱpla modeling an average line profile observed with HIRES in solid black, and a CCF observed with HARPS in dotted cyan. The same with β0 = 4.5 km s-1 and βp = 4.56 km s-1 represents a CCF observed by CORALIE, in dashed violet.
Current usage metrics show cumulative count of Article Views (full-text article views including HTML views, PDF and ePub downloads, according to the available data) and Abstracts Views on Vision4Press platform.
Data correspond to usage on the plateform after 2015. The current usage metrics is available 48-96 hours after online publication and is updated daily on week days.
Initial download of the metrics may take a while.