Fig. 5
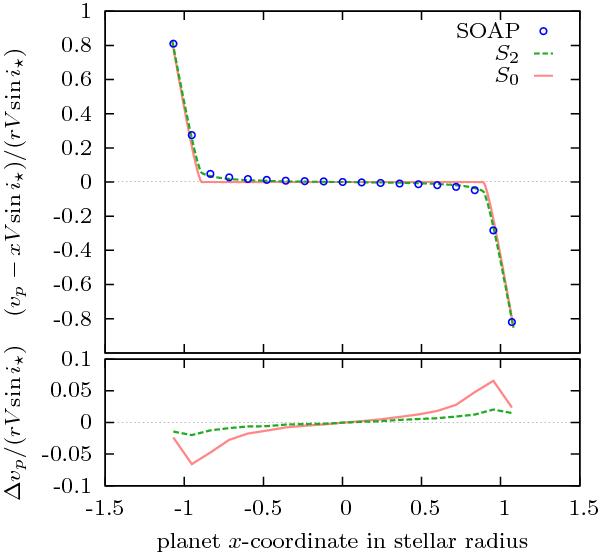
Subplanet velocity vp produced with SOAP-T (blue points), approximation S0 assuming uniform intensity below the disk of the planet (red curve), and approximation S2 taking the second derivatives of the stellar surface brightness into account, Eq. (37) (green curve).
Current usage metrics show cumulative count of Article Views (full-text article views including HTML views, PDF and ePub downloads, according to the available data) and Abstracts Views on Vision4Press platform.
Data correspond to usage on the plateform after 2015. The current usage metrics is available 48-96 hours after online publication and is updated daily on week days.
Initial download of the metrics may take a while.